EPD vertex analysis, x-y plain with different z cut selections, with 3 different zooms on the x-y plain
First of all, I replotted the plots of Mate, and fixed the scaling of the z axis, since there it was not ranged from 1 in all cases.
Mate's plots can be found here: https: //drupal.star.bnl.gov/STAR/blog/mcsanad/track-vertices-epd-hits-various-z-values
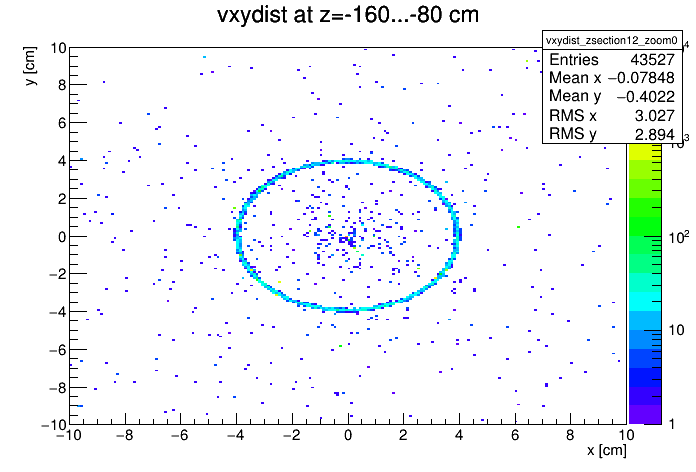
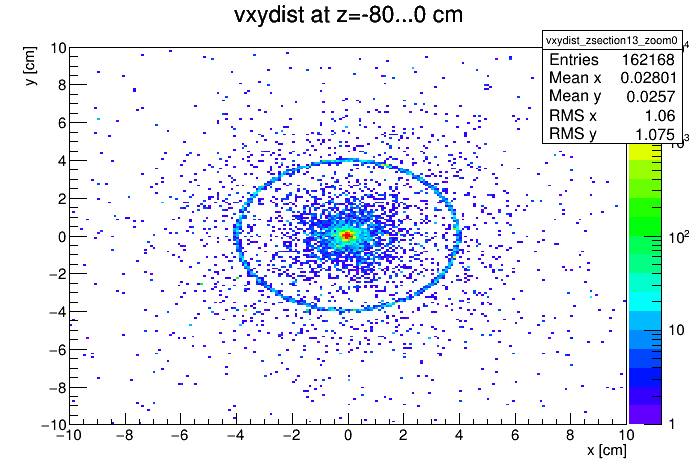
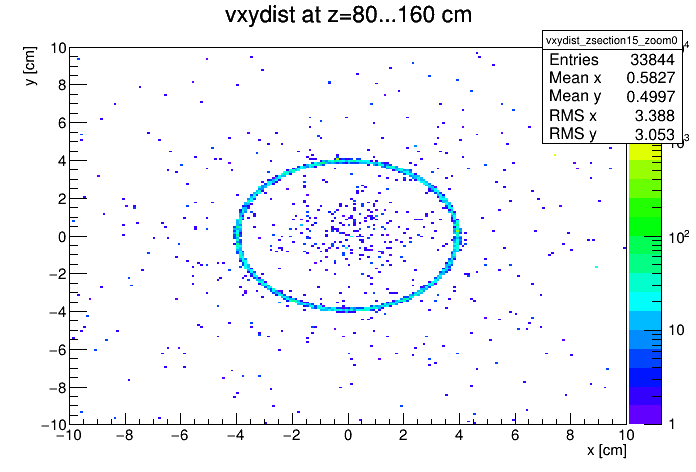
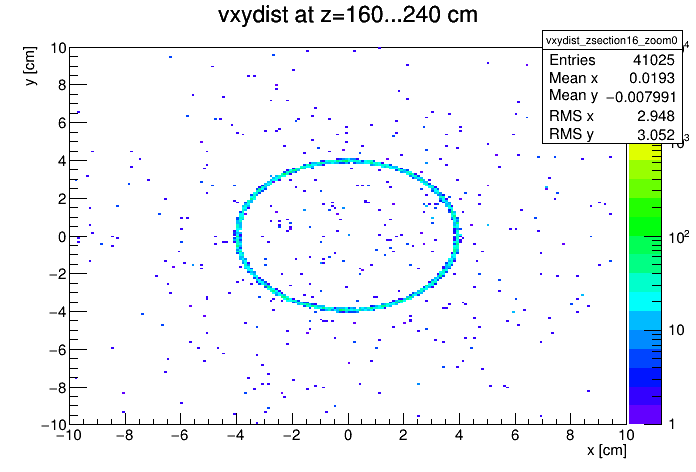
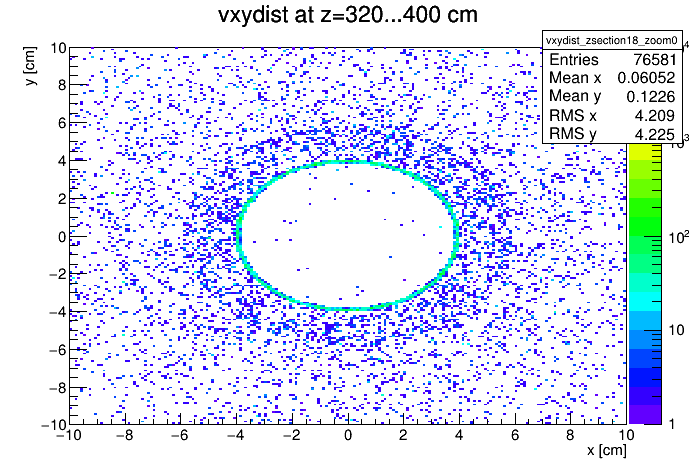
I. The x-y plane at various z values, with 3 different zooms
(I.1.) Zoom 0: x-y ranges from -10..10 centimetres:


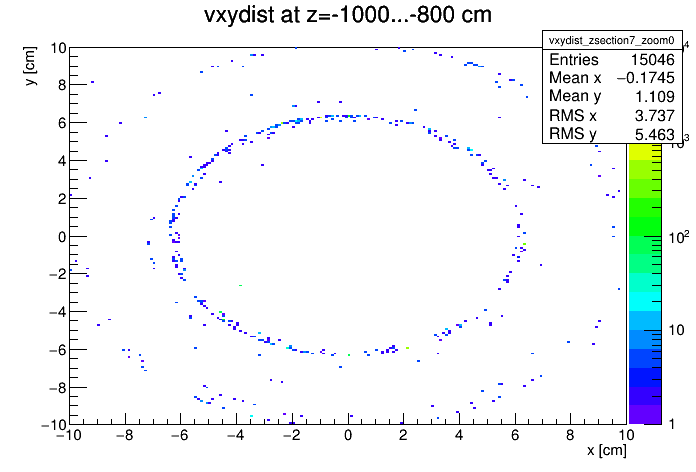
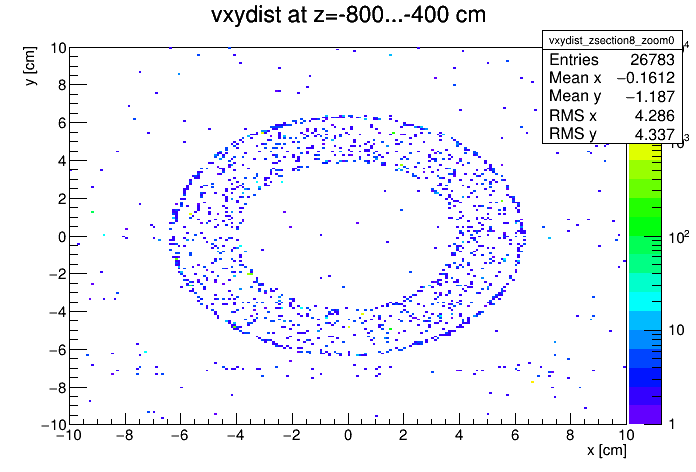
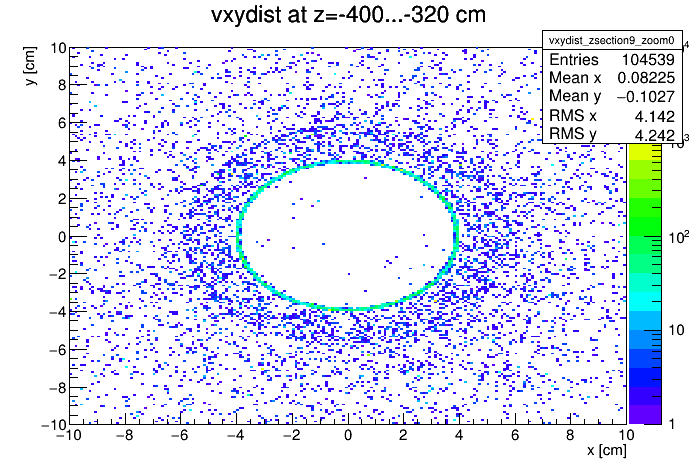
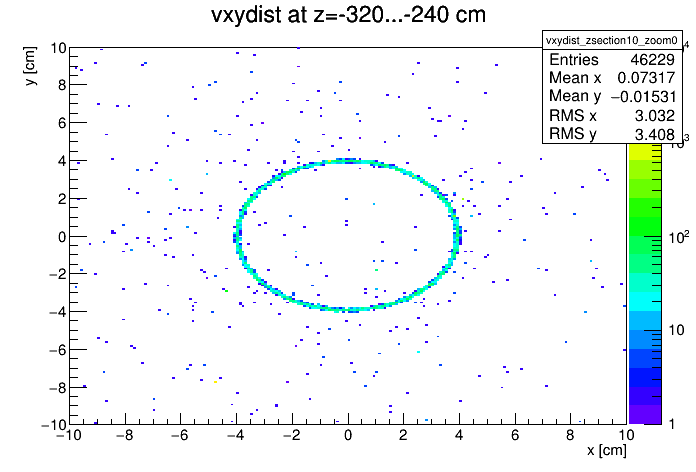


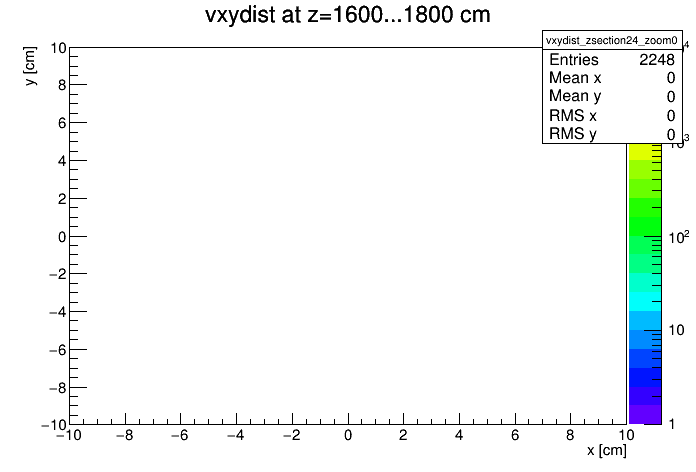

Above +/-2000 centimetres, there is not any entry.
(I.2.) Zoom 1: x-y ranges from -100..100 centimetres:


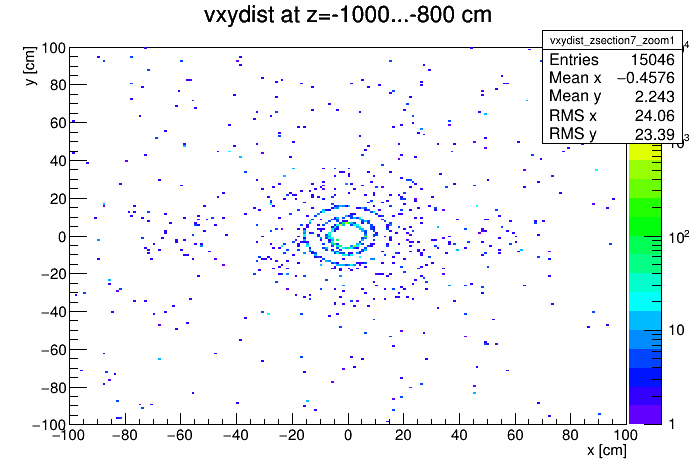
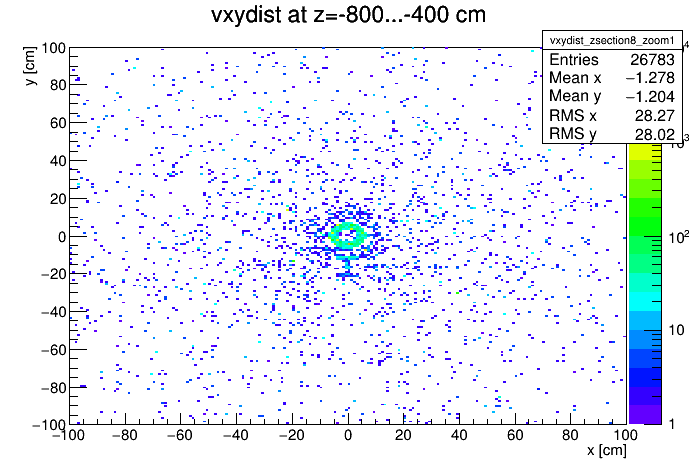
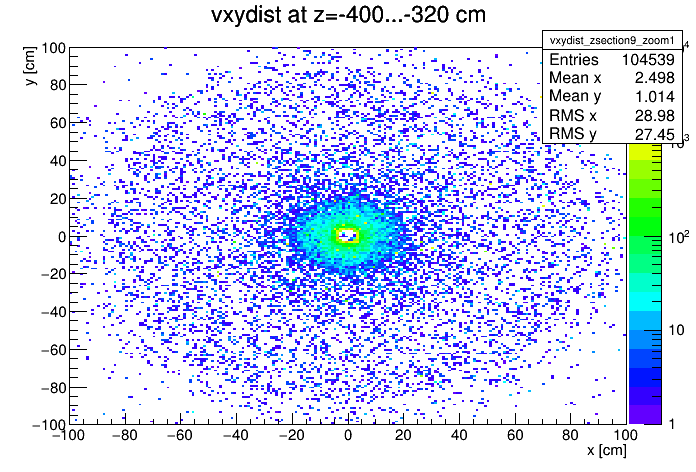
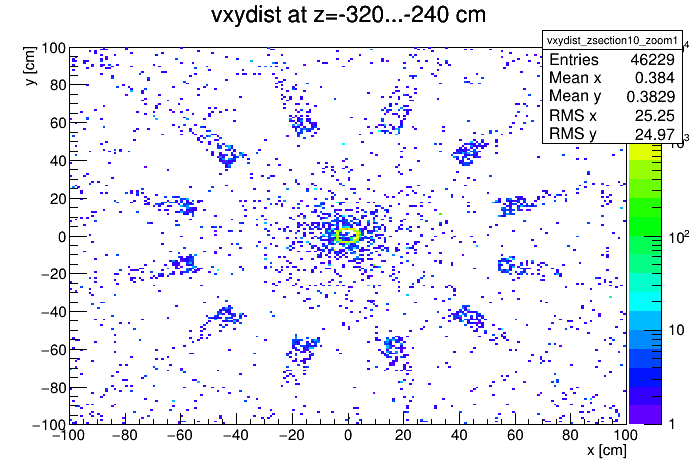
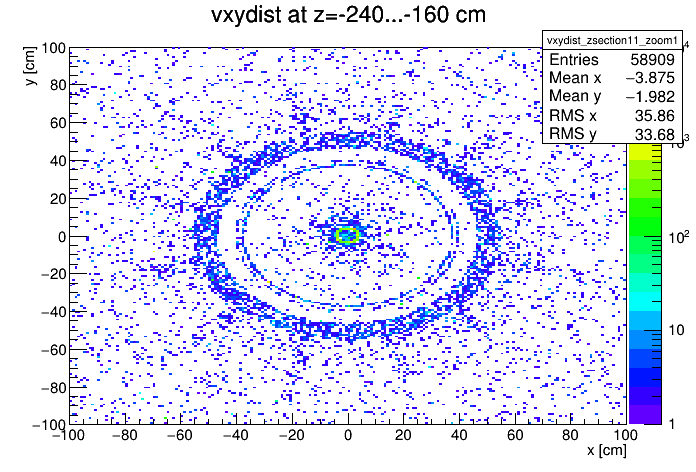
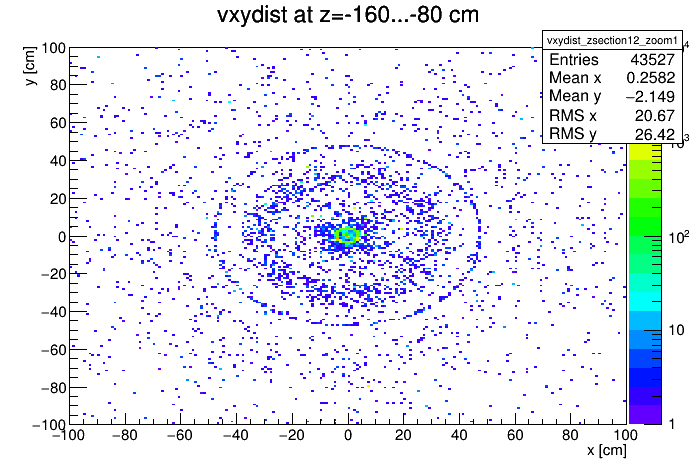
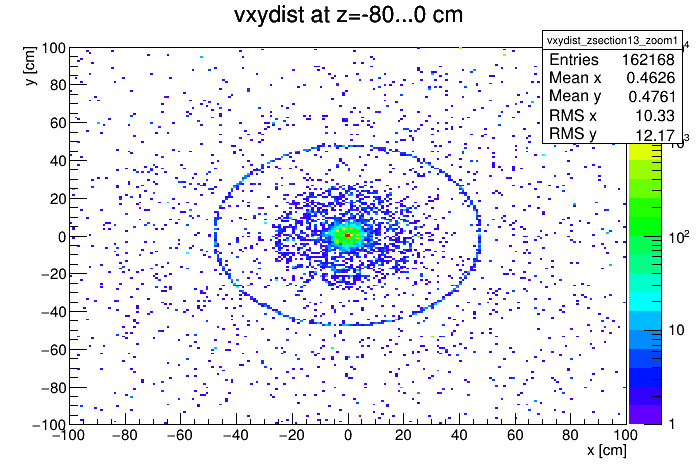
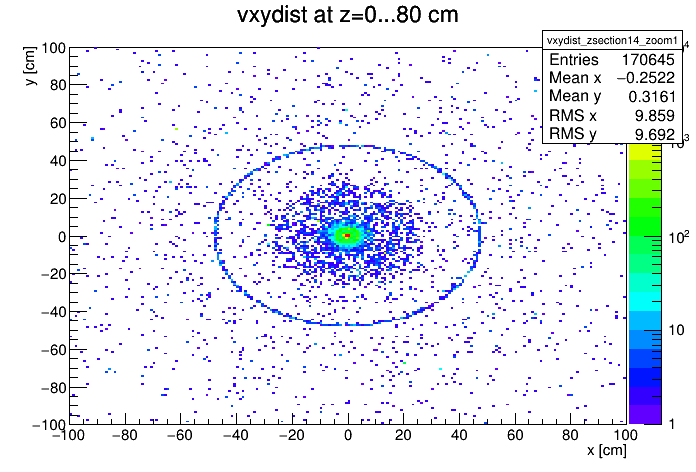
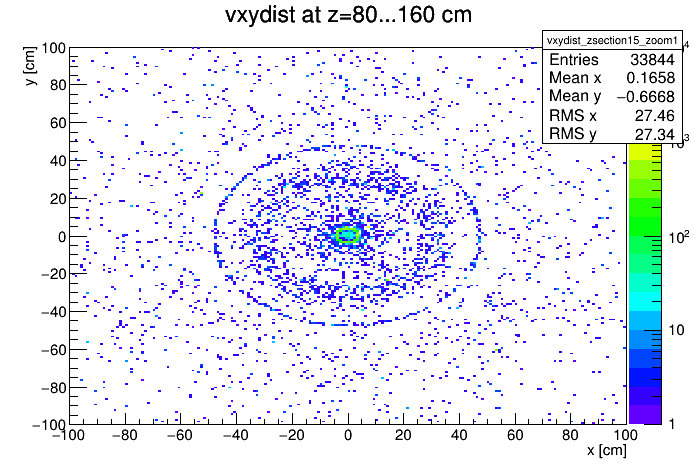
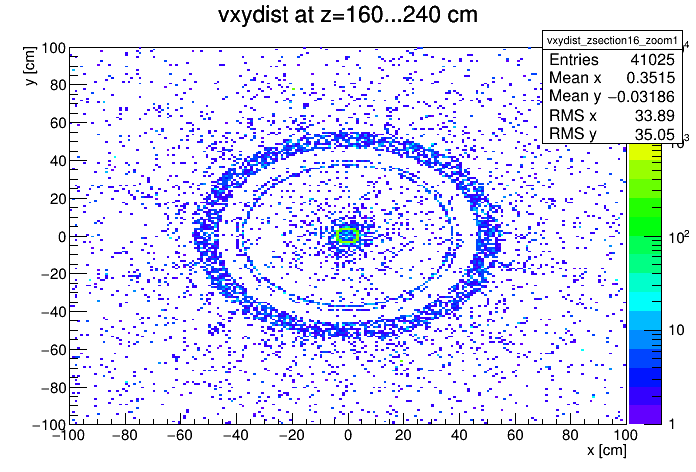

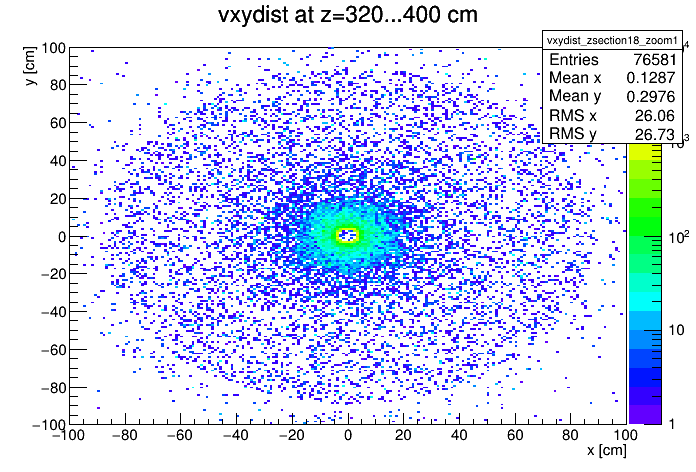
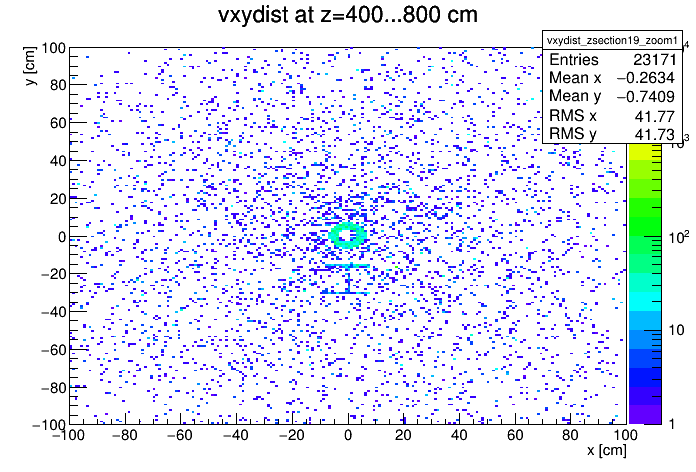
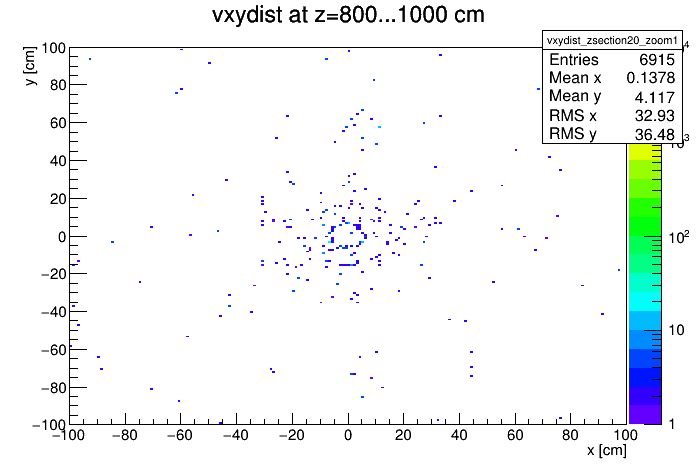
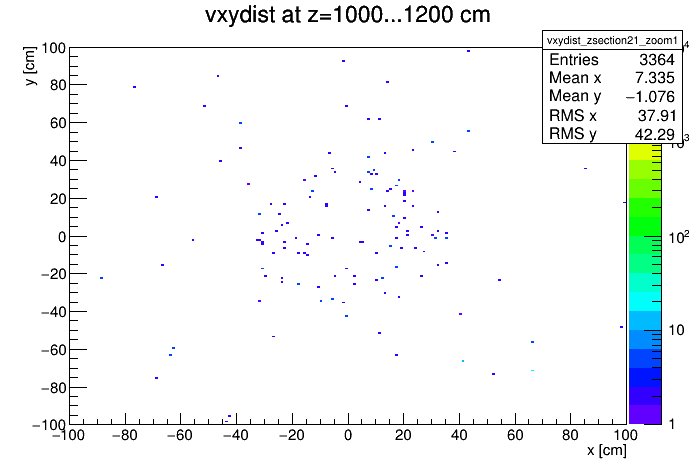


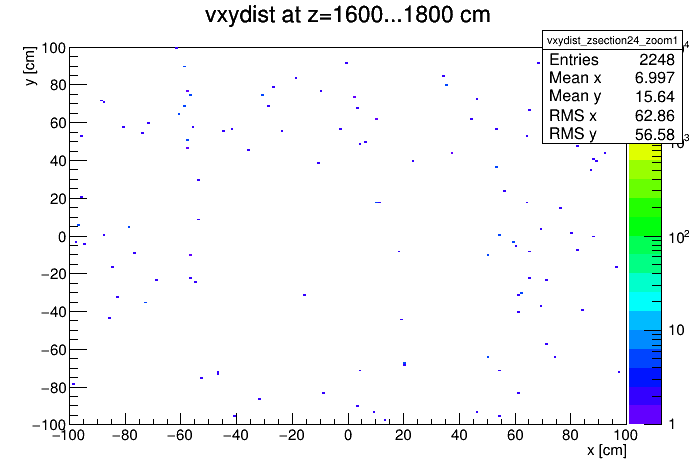

Above +/-2000 centimetres, there is not any entry.
(I.3.) Zoom 2: x-y ranges from -450..450 centimetres:
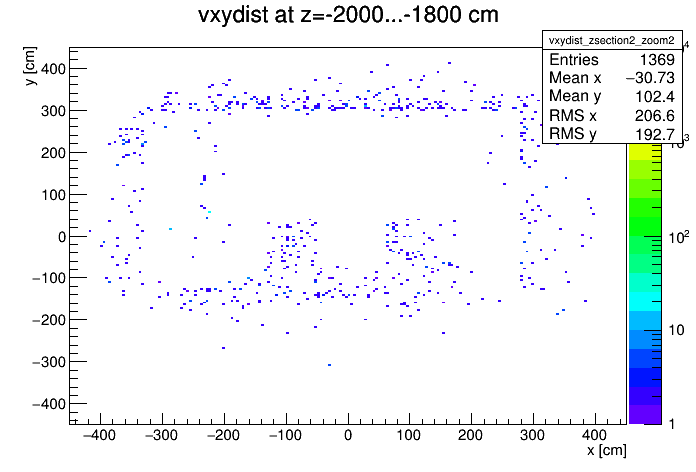
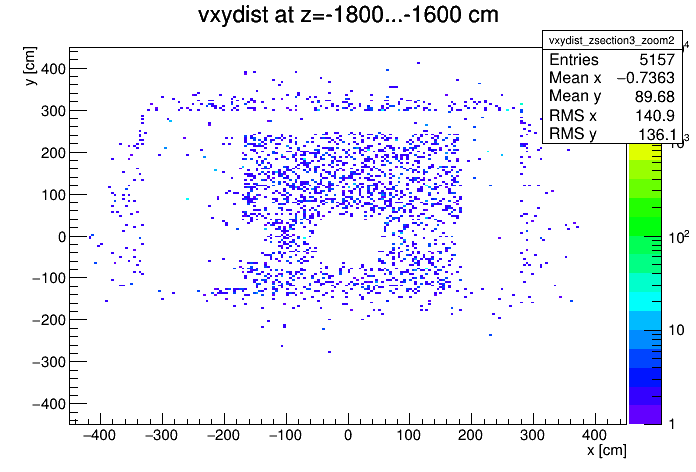
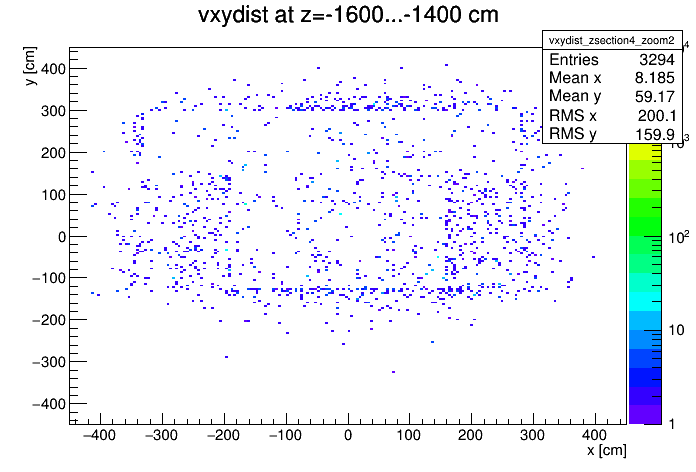
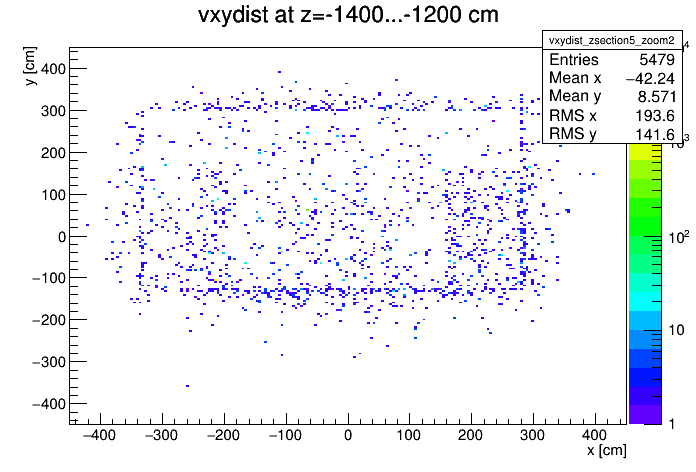
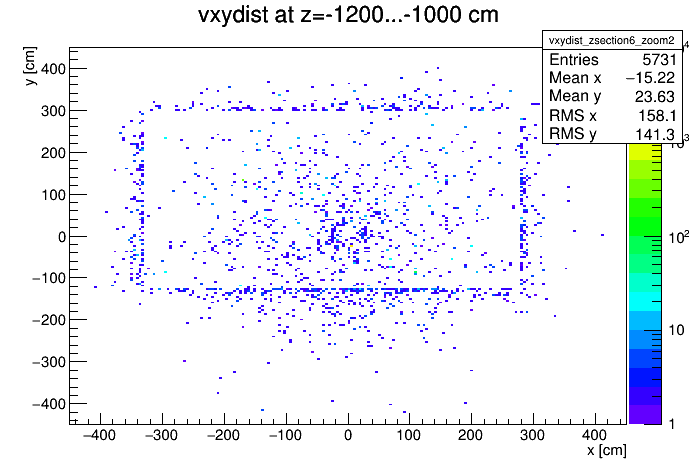
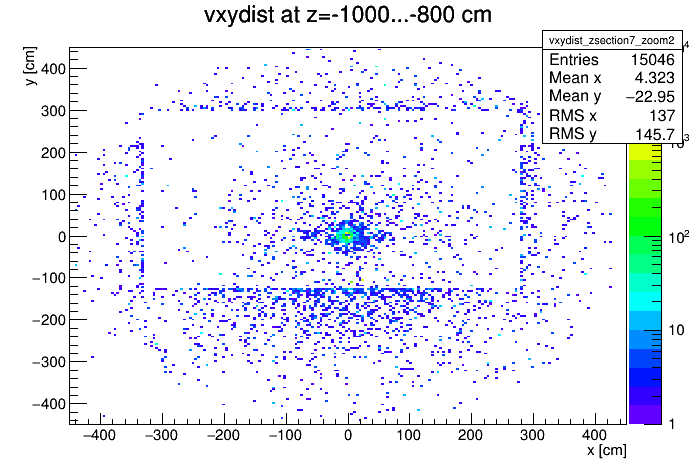
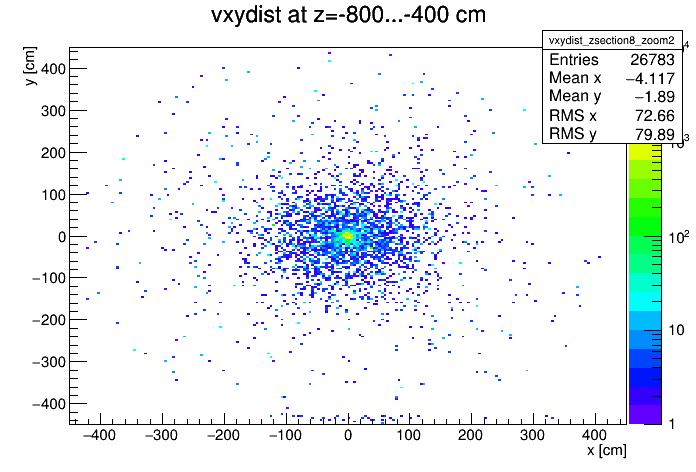
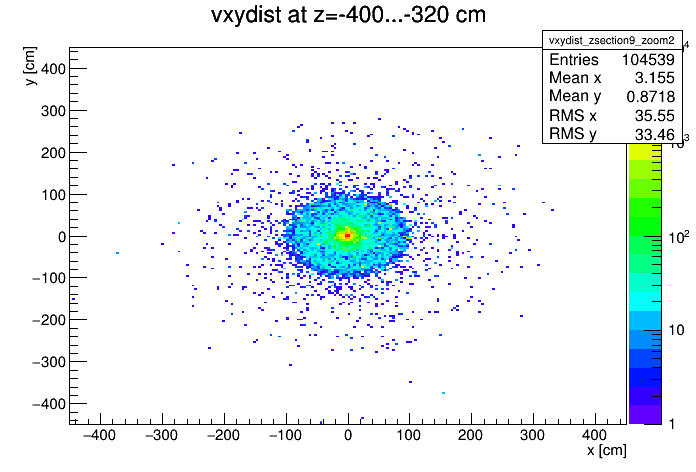
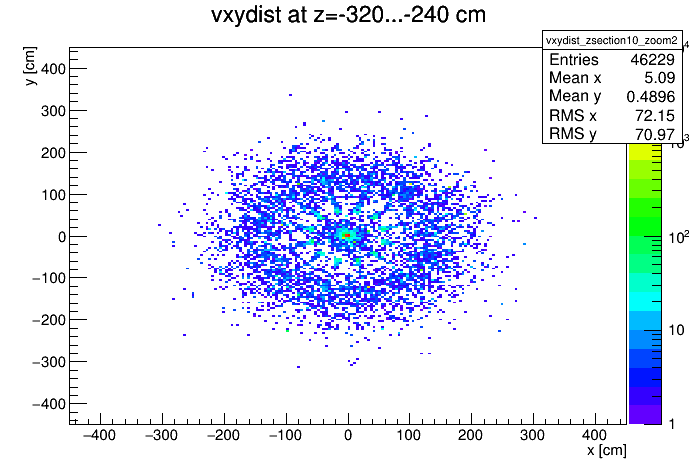
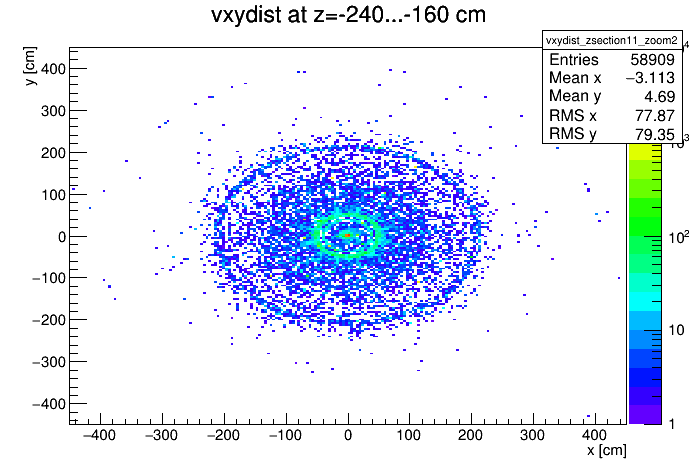
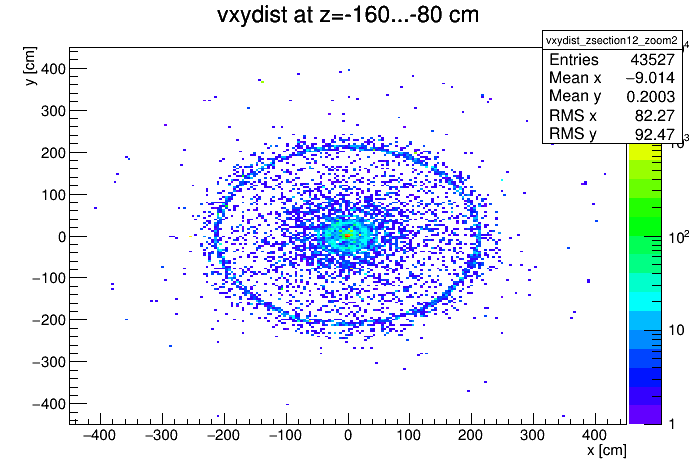
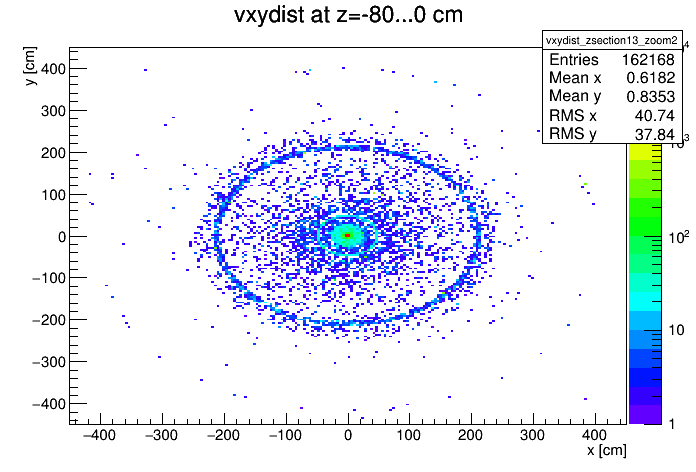
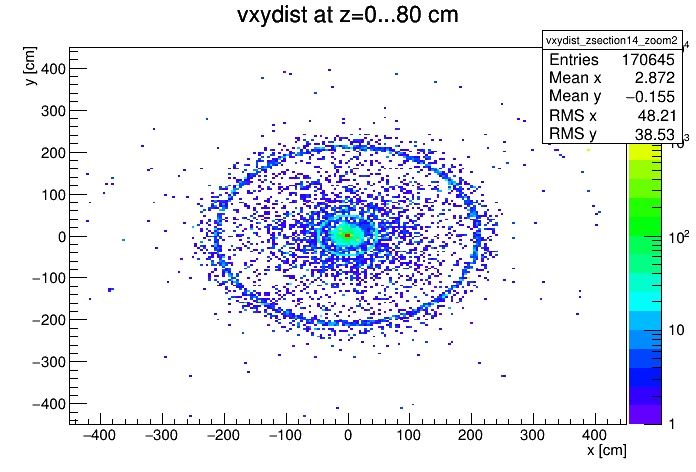
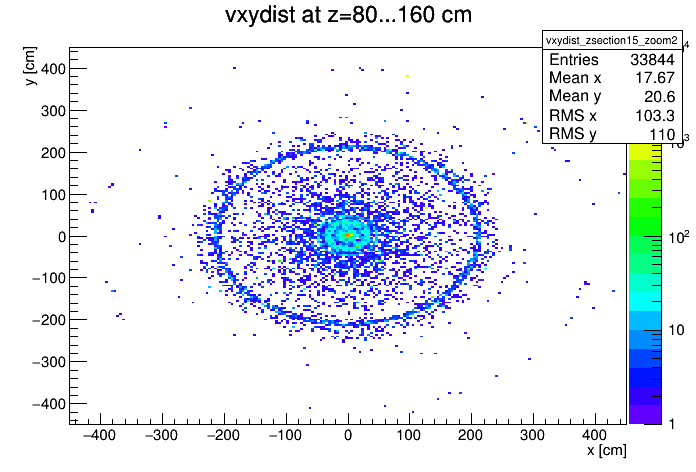
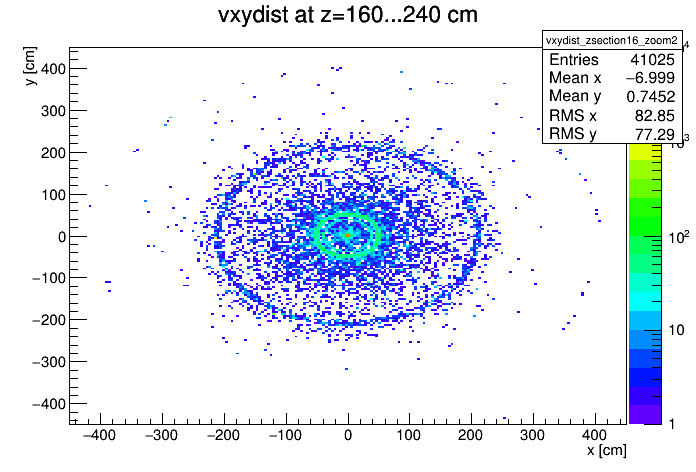
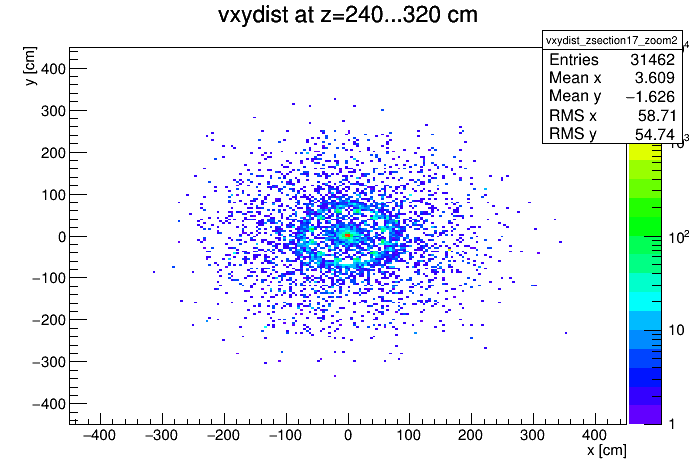
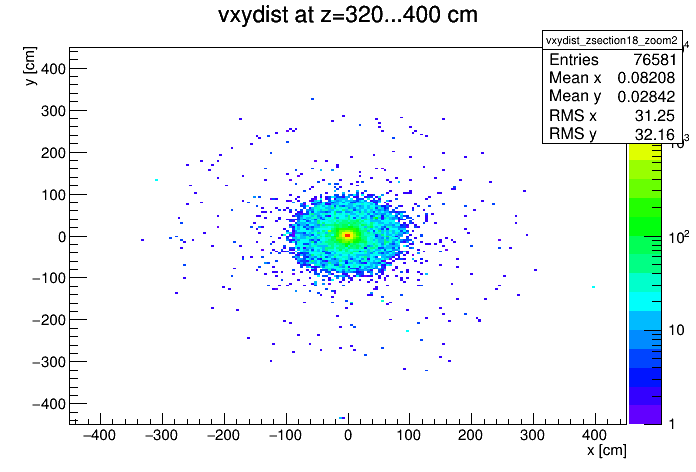
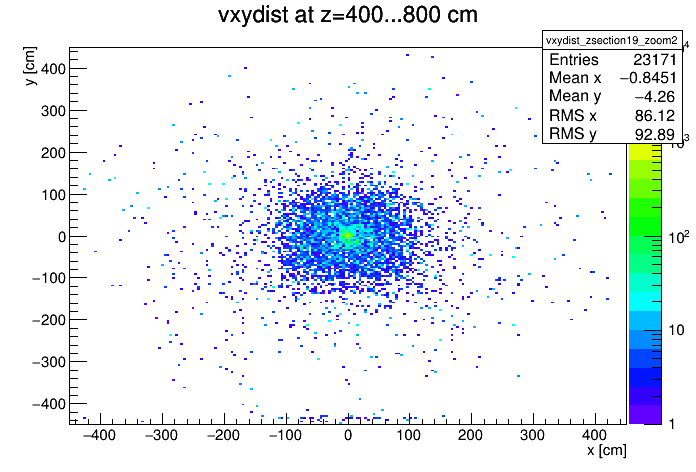
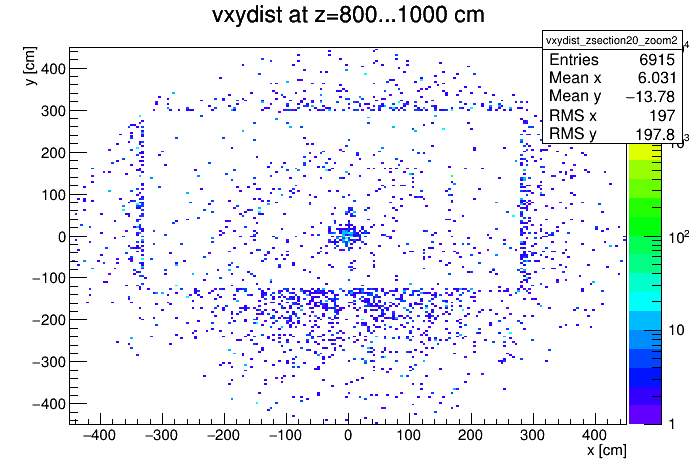
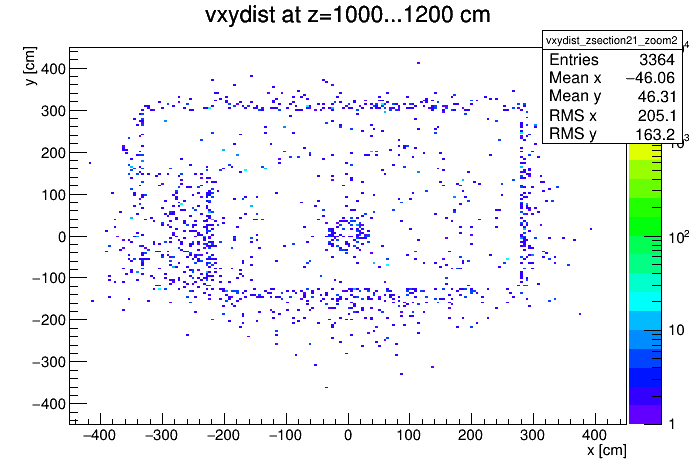
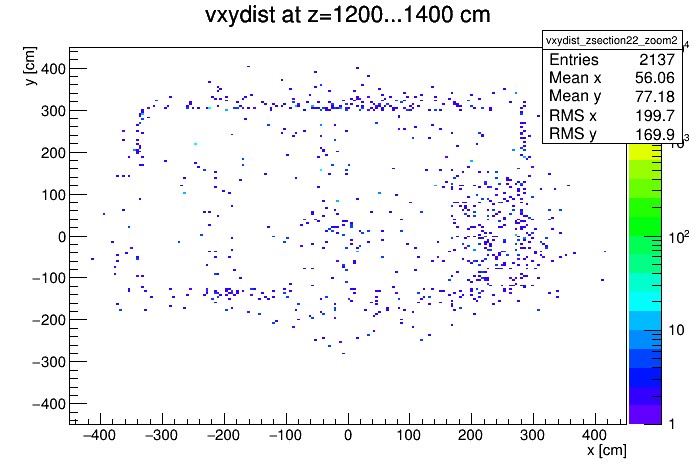
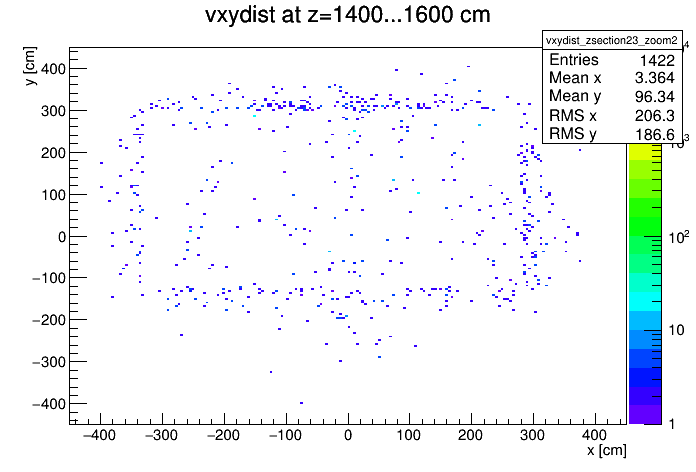
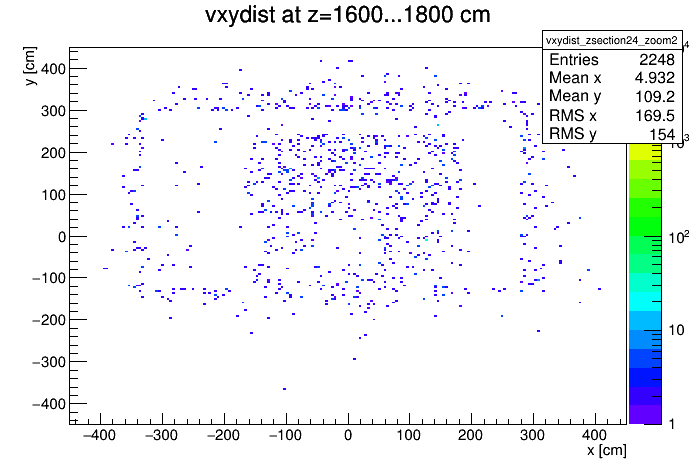
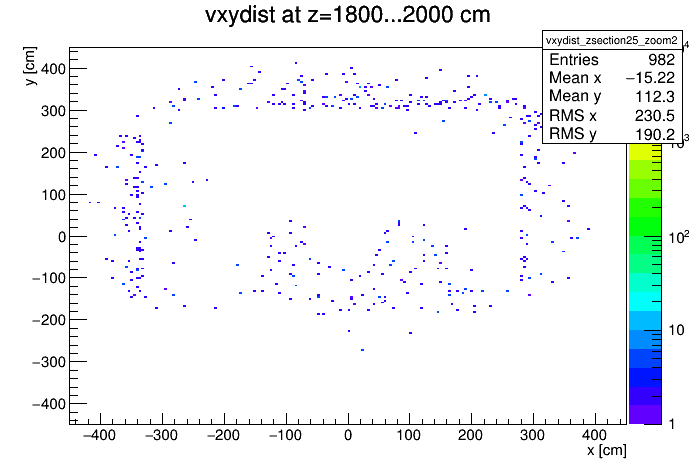
Above +/-2000 centimetres, there is not any entry.
As it can be seen from the Zoom 2 section, the mysterious rectangle shape appears at +/- z = 1800..2000 centimetres sections, where the x-y plain ranges from -400 centimetres to 400 centimetres.
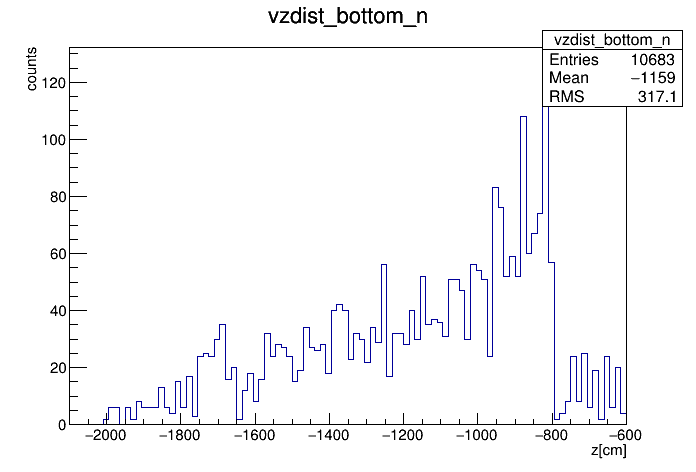
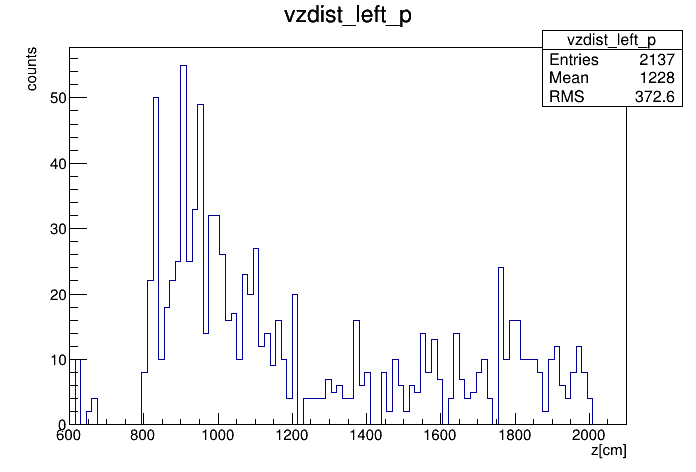
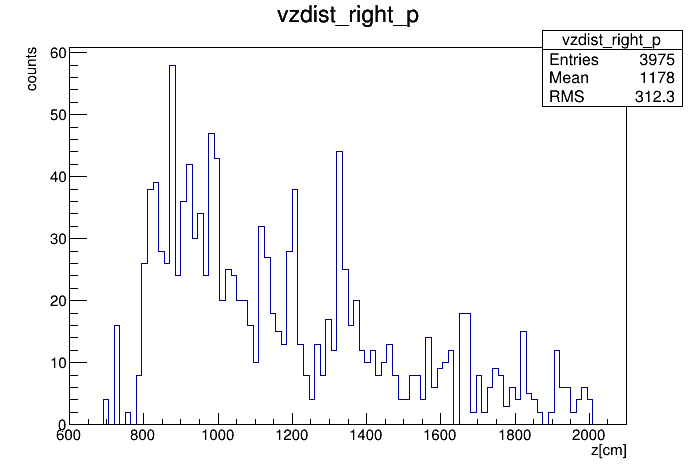
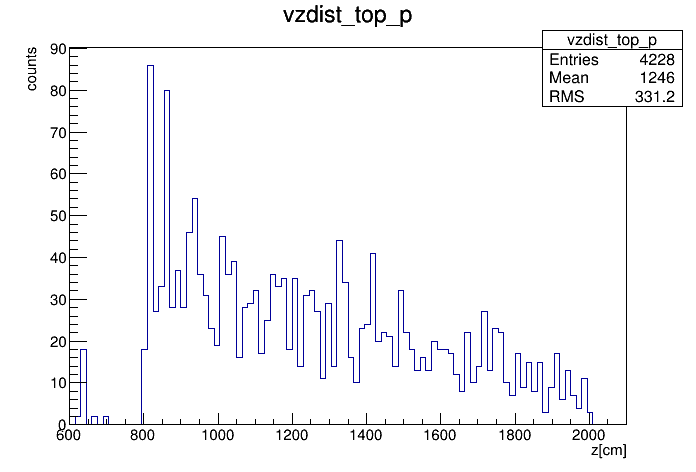
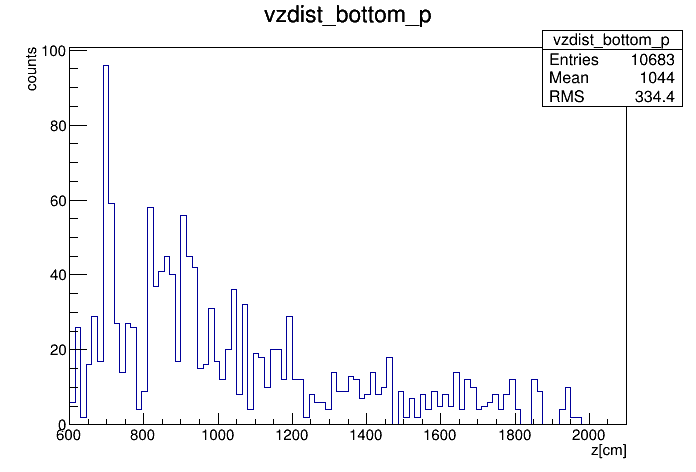
To further investigate this rectangle, I made 1D histograms, in which I plotted the vertex z distribution for the left, right, top, bottom side of the rectangle.
II. Analysing the rectangle
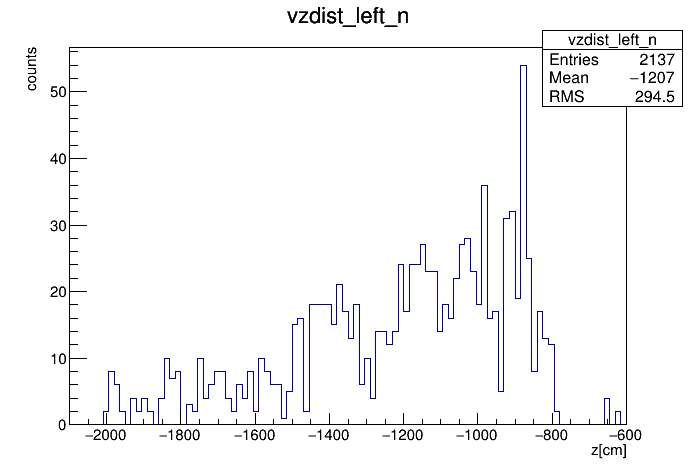
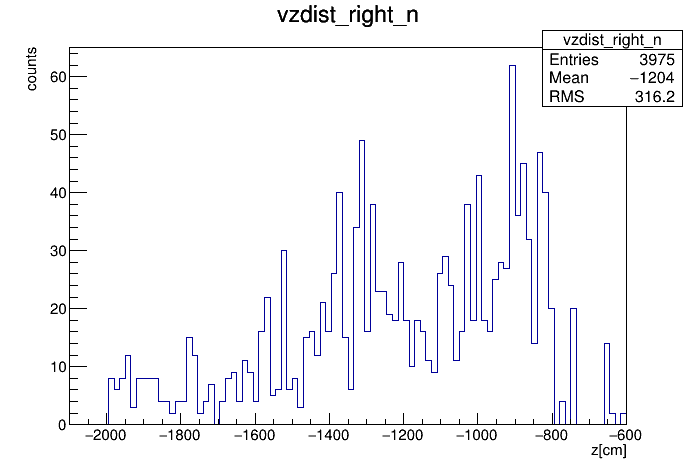
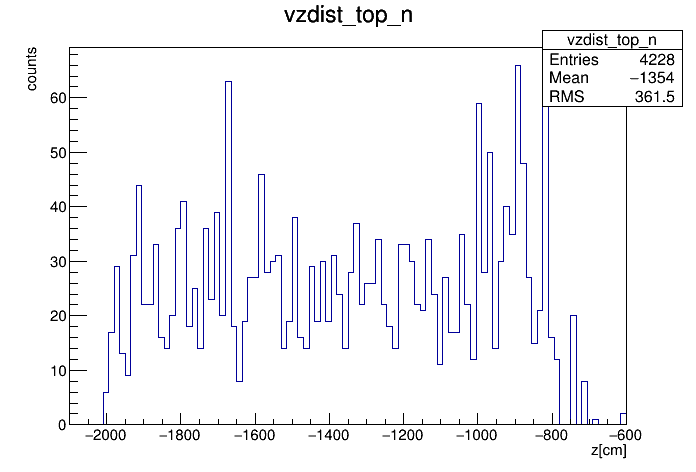
(II.1) Rectangle, vertex z 1D distributions
(II.1.1.) For negative z values, between 0...-2100 centimetres
(II.1.2.) For positive z values, between 0...2100 centimetres
To see these plots better, I plotted them to a single 1D distribution, where z ranges from -2100 centimetres to 2100 centimetres.
(II.2.) Z values between -2100 centimetres and 2100 centimetres
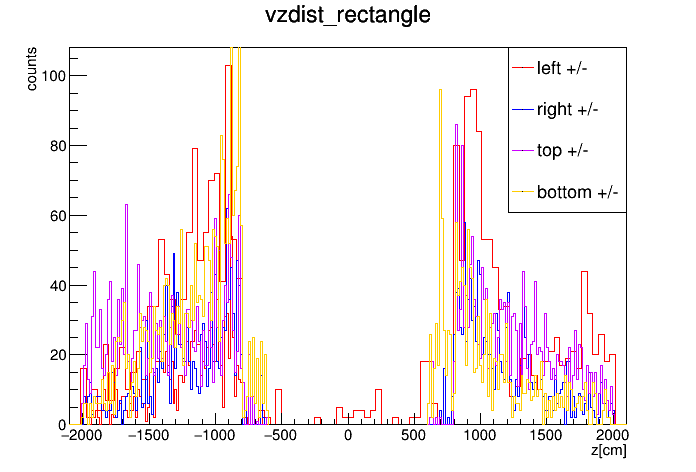
Since it's a back-scattering to the EPD, what we see is reasonable. It's clearly visible that this rectangular shape "appears" around +/- 800 centimetres at vertex z, and from that point, it decreases.
III. Fixed target scattering
Mate informed me about the fact that in the beam pipe, there is a fixed target holder around +2.1 metres in the z axis, and relatively close to the beam in the x-y plain. Consequently, I have made 2 plots, between z = +/- 1.8 metres ... +/- 2.4 metres and in the x-y plain from x,y = -3 centimetres .... +3 centimetres. Theoretically, we should see a semicircle, or some kind of curve on the positive z one.
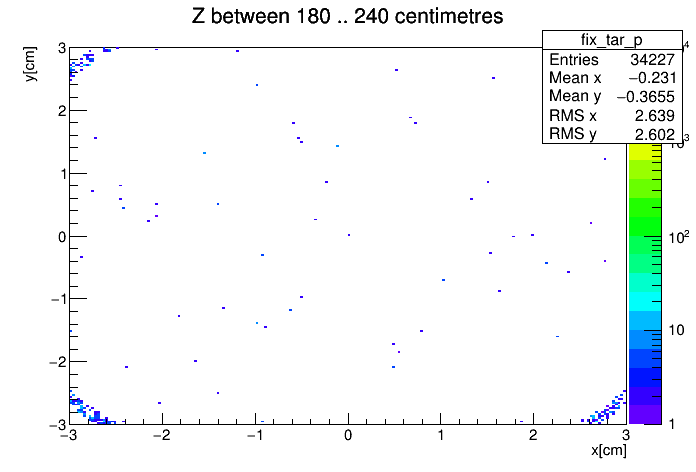
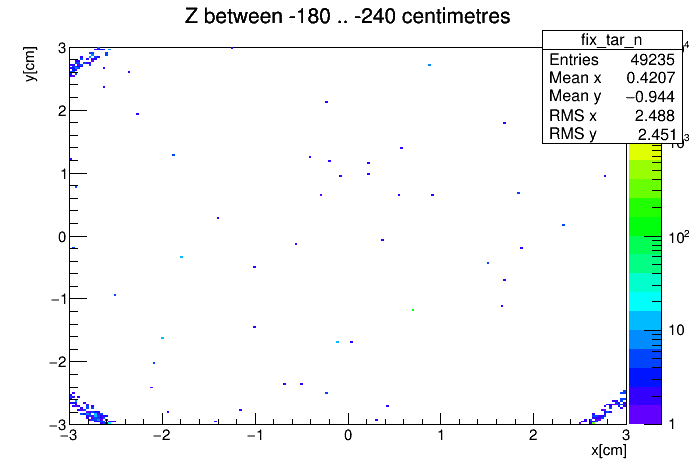
The reason why I plotted the negative z side as well is that I was hoping maybe we could see something there too.
IV. Conclusions
(1) As we investigated the vertex x-y plain on 3 different zoom ranges, with different vertex z selections, we can see some typical shapes.
(3) By taking a closer look at the rectangular shape, we can see on my unified plot that the rectangle is where the vertex z of the 4 sides (left, right, top, bottom; both + and -) are the same. Since it's an inward-scattering in the EPD, what we see is reasonable. It's clearly visible that this rectangular shape "appears" around +/- 700 centimetres at vertex z, and from that point, it decreases.
- rolandp's blog
- Login or register to post comments