Ratio Plots for single TMVA method
This blog post will serve as a quick update on plotting the ratio between the TMVA regression (MLP) and the weighted pJetpT.
Input Variables to TMVA
These are input variables for the Train tree that was used.
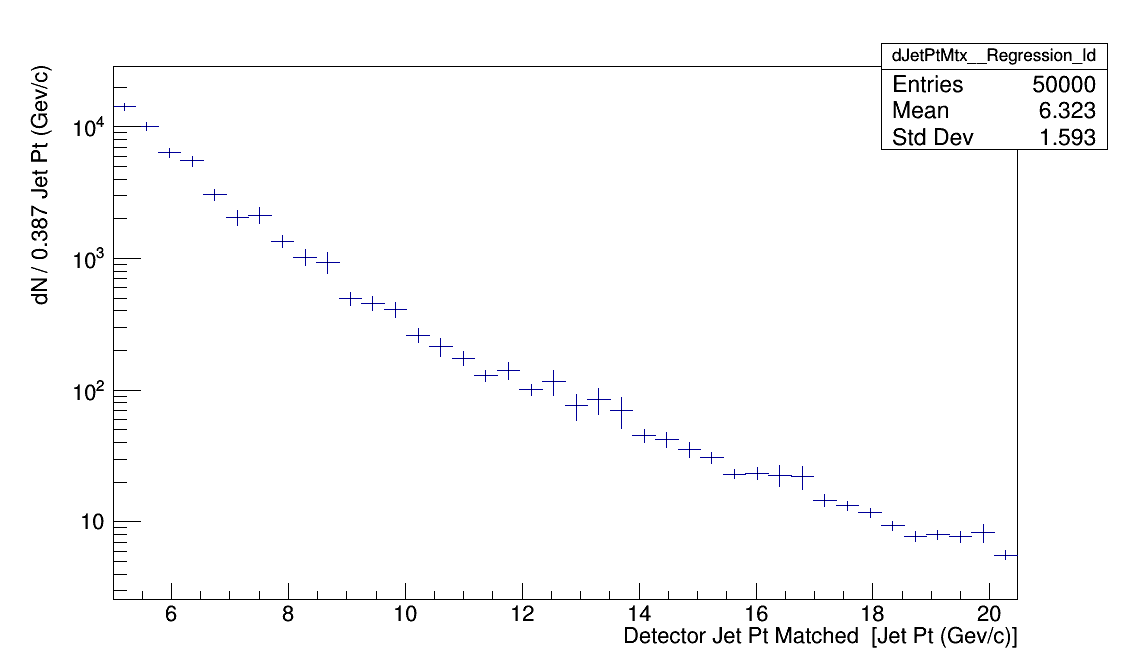
The left plot is detector eta that corresponding to the detector jet matched. The right plot is detector jet pT that was matched to a particle jet in the embedding.
.png)
This is the particle jet pT spectrum that was used in the TMVA regression. The red line is there to indicate that this is the cut off at the detector level. There are no "sub-threshold" events at the detector level which will greatly affect the way the TMVA method behaves in the lower pT region.
.png)
Comparison between MLP and pJetpT
The following figure has the upper plot being a comparison between the weighted pJetpT and the MLP regression. The lower plot shows the ratio of the two. The error bars on the ratio were set by using Sumw2() for the MLP and pJetptT histogram and using TH1::Divide().
.png)
The plot below shows the ratio without the comparison between the MLP regression and pJetpT. The uncertainties are very large at higher pT due to the lack of pJetpT in the higher pT region and MLP overshooting the pJetpT spectrum. The error bars were used by setting the error per bin with Sumw2() for MLP regression and pJetpT histograms. From there, the TH1::Divide() method was used to make the MLP/pJetpT ratio. This serves as a rudimentary look at the ratios of this regression and the uncertainties will be handled with greater detail moving on.

From looking at this simple ratio, we can see that this method is not great but that is ok. I have begun looking into which method does work and will focus on how to handled the sub-threshold events, the uncertainties for each histogram, and probing different parameters in the MLP method.
- rsalinas's blog
- Login or register to post comments