Upsilon 1S, 2S, 3S embedding QA
The full sample is ready. Please see the slides for the QA plots.
Update 11/28/2013
Regarding Daniel's questions:
1. Track quality cuts for matching
The track quailty cuts were not included in the R_BEMC vs. R_SMD cut.
Actually it does not change the situation much.
These are the matching (R_BEMC) distributions without and with the acceptance cut:
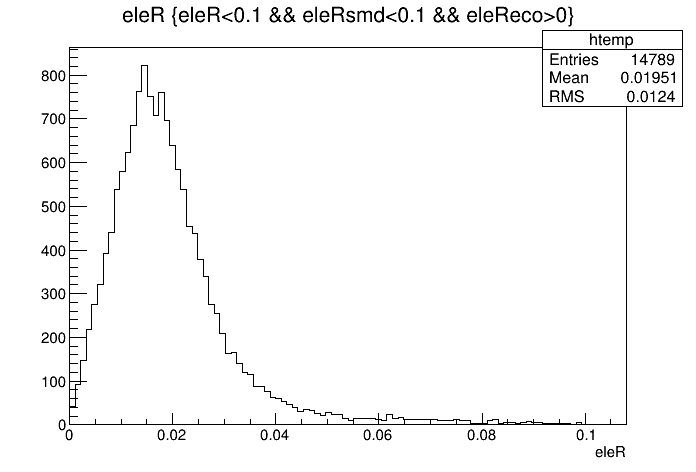
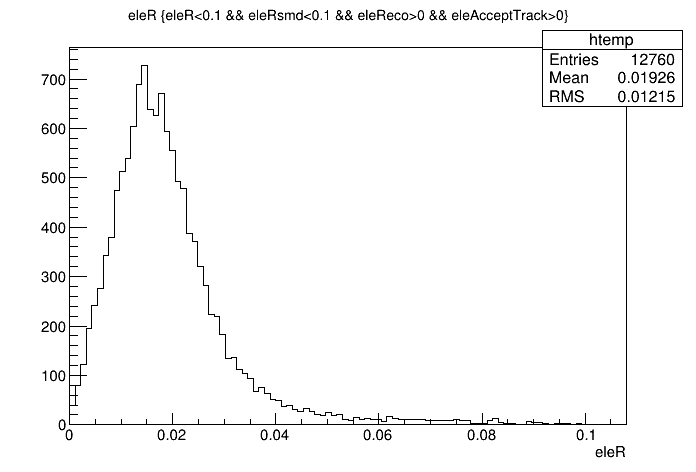
The difference in numbers:
zvtx<30: ~5% of electrons that pass the SMD matching cut are rejected by the BEMC matching cut
zvtx>30: ~14% of electrons that pass the SMD matching cut are rejected by the BEMC matching cut
any zvtx: ~8% of electrons that pass the SMD matching cut are rejected by the BEMC matching cut
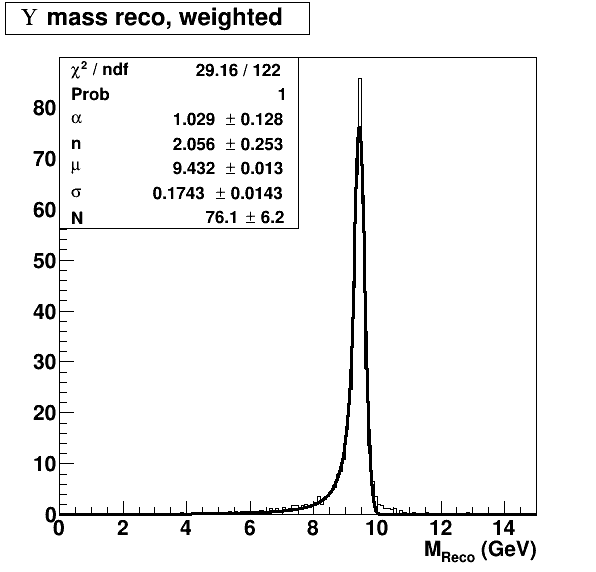
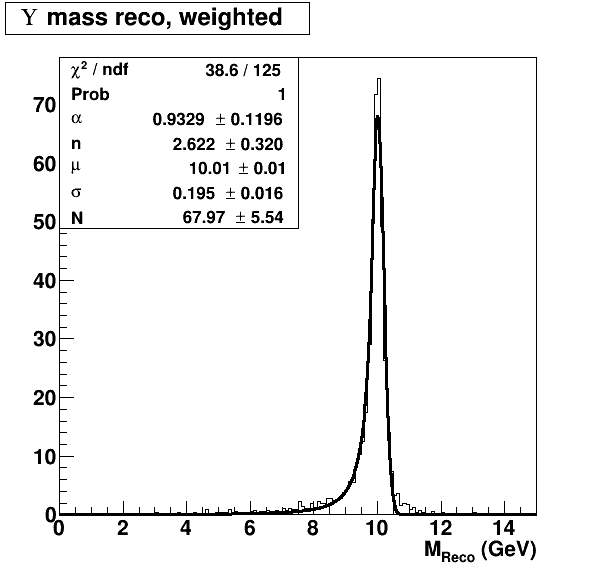
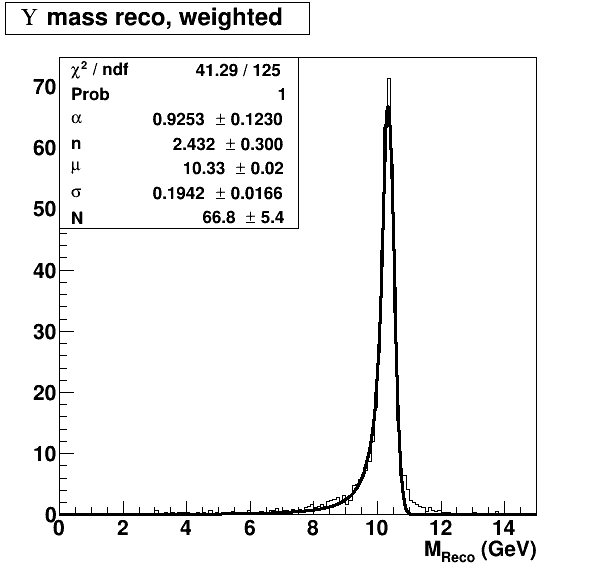
2. Fitting the peak
If one does the fit on the pT-weighted invariant mass peaks, than the fit converges with prob=1, and the peaks will be at the desired position.
Preliminary efficiencies
Upsilon 1S
Set\Eff Acc+Trig+Trk Mass Match EovrP (nSigmaE) (Comp2) Total
0-60% 0.162069 0.992627 0.642547 0.765839 0.7735 0.760471 0.0465661
0-10% 0.134134 0.993441 0.662262 0.641828 0.7735 0.682025 0.0298807
10-30% 0.165859 0.993043 0.616851 0.765115 0.7735 0.77535 0.0466201
30-60% 0.204645 0.990842 0.668099 0.91587 0.7735 0.841164 0.0807276
pT<2 0.144723 0.988528 0.639187 0.737514 0.7735 0.75429 0.0393479
2<pT<4 0.173634 0.997152 0.640171 0.805909 0.7735 0.763649 0.0527632
4<pT 0.204302 0.994478 0.658192 0.758287 0.7735 0.775835 0.0608532
y<.5 0.222073 0.992548 0.652421 0.752829 0.7735 0.777702 0.0651248
.5<y<1 0.10283 0.992794 0.621495 0.794957 0.7735 0.741253 0.0289191
Upsilon 2S
Set\Eff Acc+Trig+Trk Mass Match EovrP (nSigmaE) (Comp2) Total
0-60% 0.178091 0.992498 0.651761 0.798054 0.7735 0.771605 0.0548716
0-10% 0.149262 0.992983 0.687064 0.668384 0.7735 0.712621 0.0375174
10-30% 0.182446 0.991072 0.632921 0.824294 0.7735 0.776046 0.0566266
30-60% 0.222684 0.994812 0.645003 0.923378 0.7735 0.848631 0.0866063
pT<2 0.16907 0.994752 0.672733 0.818898 0.7735 0.77306 0.0554022
2<pT<4 0.183332 0.990535 0.624561 0.774981 0.7735 0.7714 0.0524462
4<pT 0.203416 0.989118 0.642437 0.773771 0.7735 0.765917 0.0592541
y<.5 0.237847 0.990469 0.666959 0.784681 0.7735 0.786881 0.075041
.5<y<1 0.118084 0.996604 0.621021 0.827106 0.7735 0.754257 0.0352665
Upsilon 3S
Set\Eff Acc+Trig+Trk Mass Match EovrP (nSigmaE) (Comp2) Total
0-60% 0.188975 0.986803 0.628902 0.816395 0.7735 0.768939 0.0569469
0-10% 0.166221 0.988217 0.632685 0.719823 0.7735 0.711672 0.0411806
10-30% 0.192063 0.983495 0.63285 0.827127 0.7735 0.782308 0.059831
30-60% 0.224265 0.991919 0.615134 0.931925 0.7735 0.825935 0.0814692
pT<2 0.174765 0.986289 0.636361 0.800522 0.7735 0.770124 0.0523067
2<pT<4 0.206584 0.987008 0.619679 0.840039 0.7735 0.766161 0.0629019
4<pT 0.204585 0.988184 0.625663 0.814163 0.7735 0.770921 0.0614093
y<.5 0.252782 0.98961 0.63069 0.814234 0.7735 0.790422 0.0785408
.5<y<1 0.126059 0.981253 0.625369 0.820705 0.7735 0.744565 0.036563
(the numbers in the parenthesis should be determined from data)
- rvertesi's blog
- Login or register to post comments
