Comparing Total and xnxn cross sections in STARlight
Comparing Total and xnxn cross sections in STARlight.
Plots are for p_t, rapidity, and mass.
Here is the link for pp event at LHC going into Y->mumu:
drupal.star.bnl.gov/STAR/system/files/lhcppupsilonmumu.pdf
Here is the link for pp events at LHC:
drupal.star.bnl.gov/STAR/system/files/pplhc.pdf
Here is the link for pp events at RHIC:
drupal.star.bnl.gov/STAR/system/files/pprhic.pdf
Here is the link for rho(913) simulated for PbPb at LHC:
http://drupal.star.bnl.gov/STAR/system/files/913lhcpbpb.pdf
Here is the link for rho(913) simulated for AuAu at RHIC:
http://drupal.star.bnl.gov/STAR/system/files/913rhicauau.pdf
Here is the link for rho(913) simulated for dAu (incoherent) at RHIC:
http://drupal.star.bnl.gov/STAR/system/files/incoherentdAuRHIC.pdf
Here is the link for upsilon simulated for PbPb at LHC:
http://drupal.star.bnl.gov/STAR/system/files/upsilonmumulhcpbpb.pdf
Here is the link for ee simulated for PbPb at LHC--also plotted 100k events where Mass >= 1.GeV->10GeV:
http://drupal.star.bnl.gov/STAR/system/files/eelhcpbpb.pdf
Here is the link for ee simulated for AuAu at RHIC--also plotted 100k events where Mass >= 1.GeV->10GeV:
http://drupal.star.bnl.gov/STAR/system/files/eerhicauau.pdf
Here is the link for f2 simulated for PbPb at LHC:
http://drupal.star.bnl.gov/STAR/system/files/f2lhcpbpb.pdf
Here is the link for f2 simulated for AuAu at RHIC:
http://drupal.star.bnl.gov/STAR/system/files/f2rhicauau.pdf
List of comparison plots we wanted to make:
drupal.star.bnl.gov/STAR/system/files/list.doc
~~~~~~~~~~~~~~~~~~~~~~~~~~~~~~~~~~~~~~~~~~~~~~~~~~~~~~~~~~~
Link to a draft of the poster:
ppt:
---------------------------------------------------------------------------------
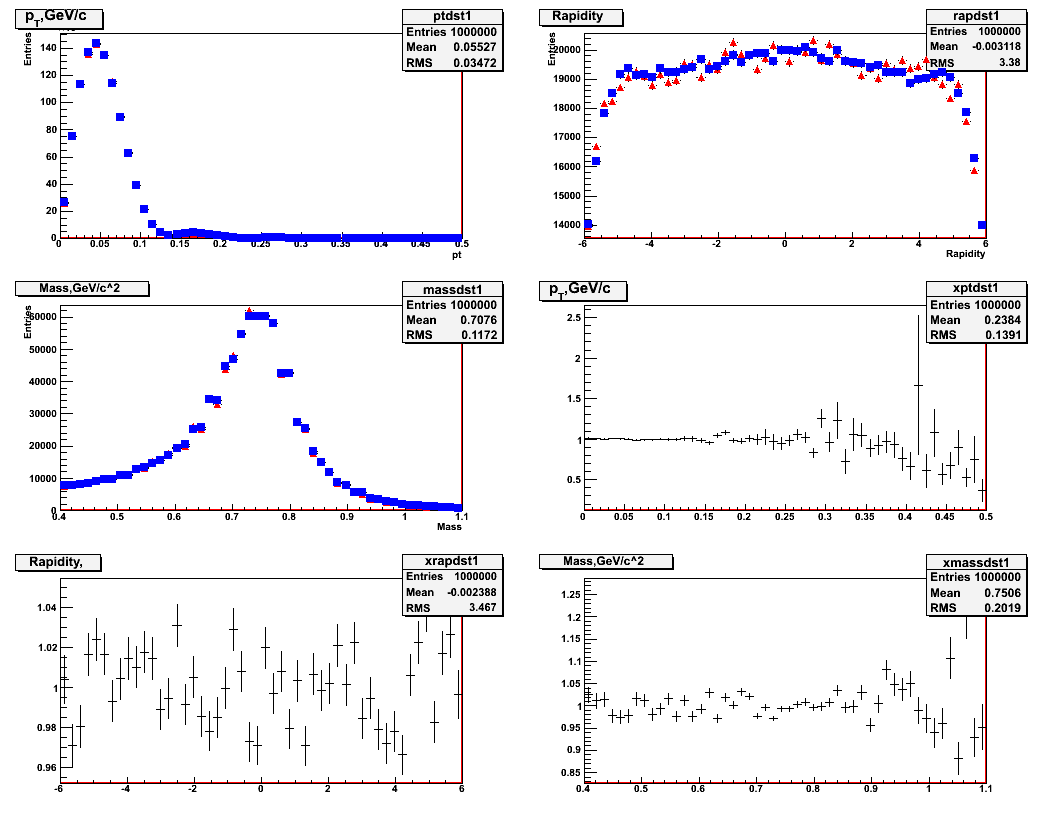
Comparisons of rho(913) (has direct pion) for lhc pb-pb.
There are three plots of the same thing. Blue is C++ and Red is FORTRAN.
The rapidity plot is the one of interest.... The first plot has ROOT using 100bins.
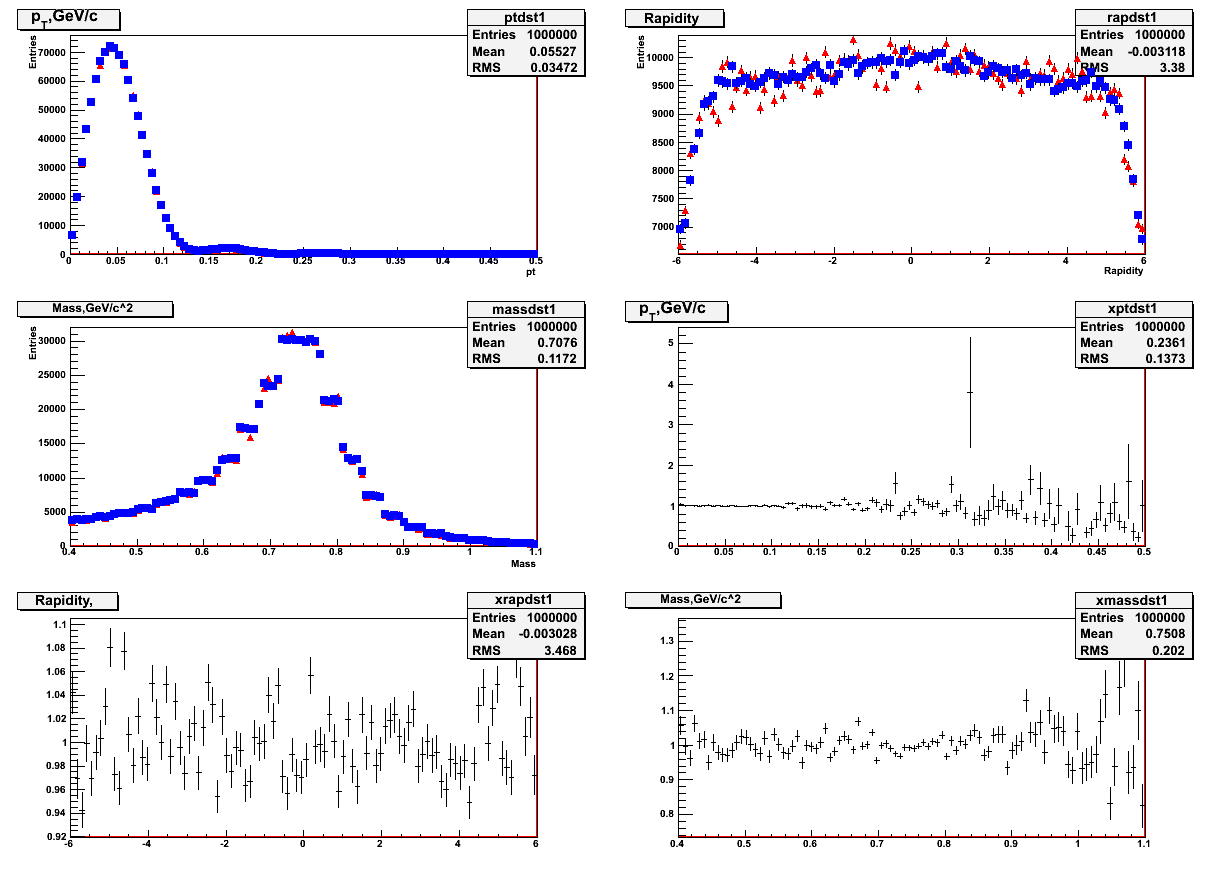
Here is the ROOT plot with 200bins.
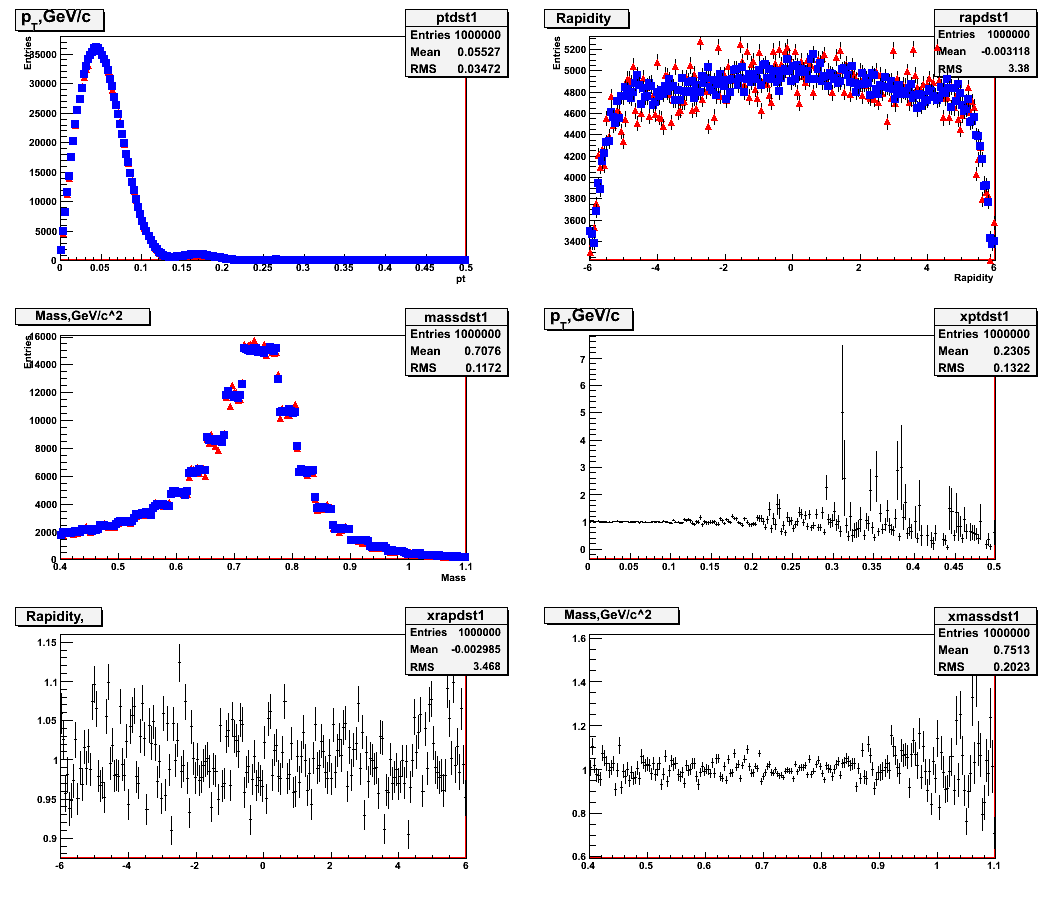
And here is the ROOT plot with 50bins.
Here are the input settings used to generate the events:
82
207
2963.5
1.5
-1
40
8.
80
3
1000000
913
345333
2
5
0
1.
0.24
120
~~~~~~~~~~~~~~~~~~~~~~~~~~~~~~~~~~~~~~~~~~~~~~~~~~~~~~~~~~~~~~~~~~~~~~~~~~~~~~~~~~~~~~~~~~
The following is old and should be redone...
Comparing Total and xnxn cross sections in STARlight.
Plots are for p_t, rapidity, and mass.
The comparisons are attached in the pdf along with input parameters.
- sbutter's blog
- Login or register to post comments