- sdhamija's home page
- Posts
- 2013
- 2012
- December (1)
- November (4)
- October (3)
- September (4)
- August (3)
- July (1)
- June (4)
- May (3)
- April (2)
- March (2)
- February (9)
- January (3)
- 2011
- December (1)
- November (6)
- October (4)
- September (4)
- August (3)
- July (8)
- June (6)
- May (5)
- April (1)
- March (2)
- February (6)
- January (7)
- 2010
- My blog
- Post new blog entry
- All blogs
BDT numbers sorted into different pT bins
BDT numbers sorted into different pT bins
These numbers have been sorted into three different pT bins i.e 7-10(inclusive), 10-15(inclusive) and 15-20(inclusive).
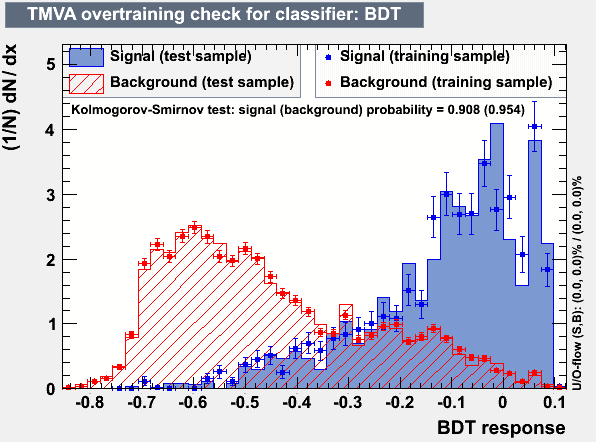
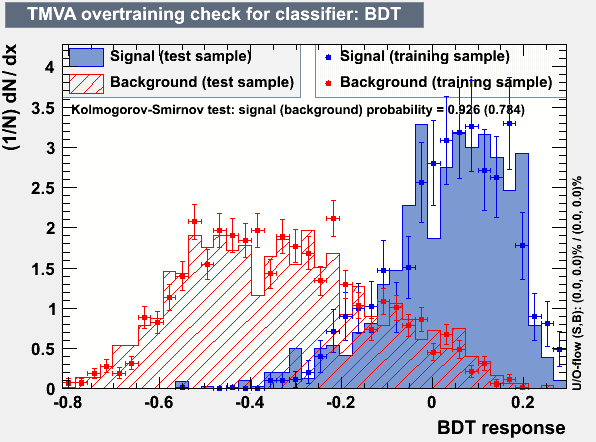
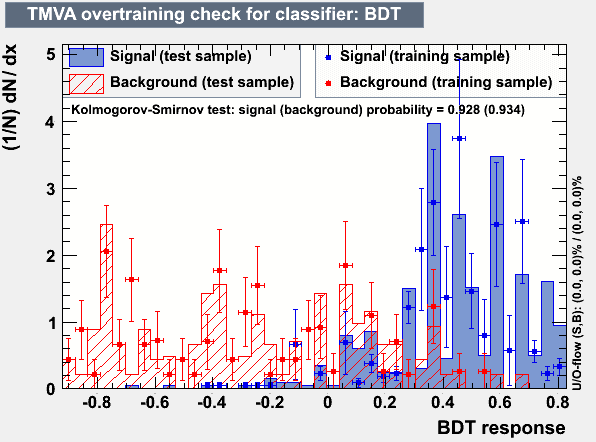
(I) Overtraining Check Plots
(a) pT (7-10) (b) pT (10-15)
(c) pT (15-20)
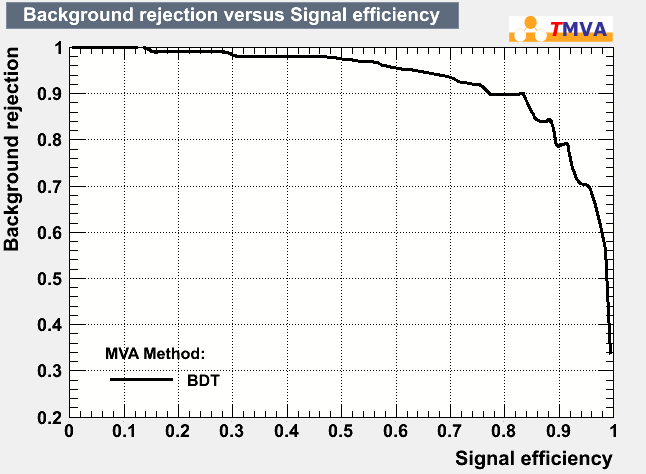
II) Background rejection vs signal efficiency plots
(a) pT (7-10) (b) pT (10-15)
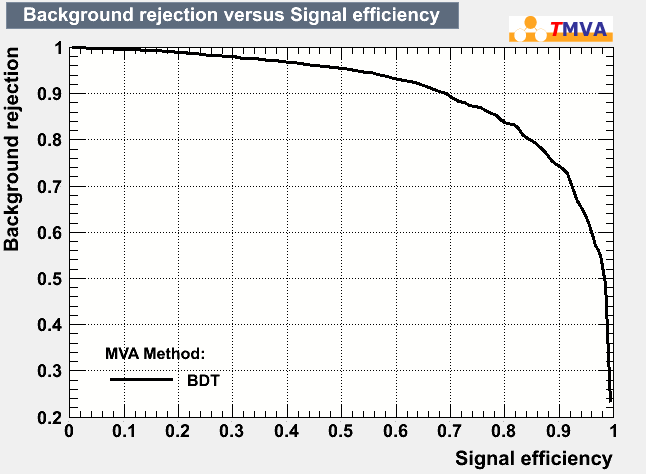
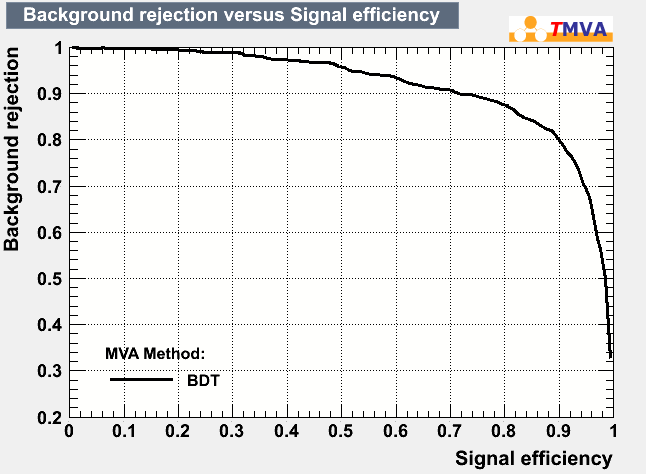
(c) pT (15-20)
(III) Efficiency plots
(a) pT (7-10) (b) pT (10-15)
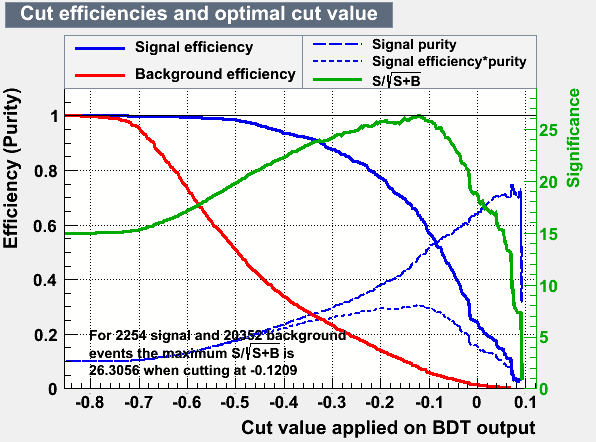
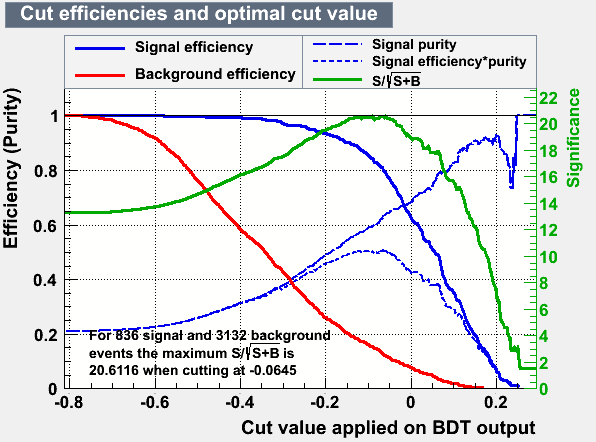
(c) pT (15-20)
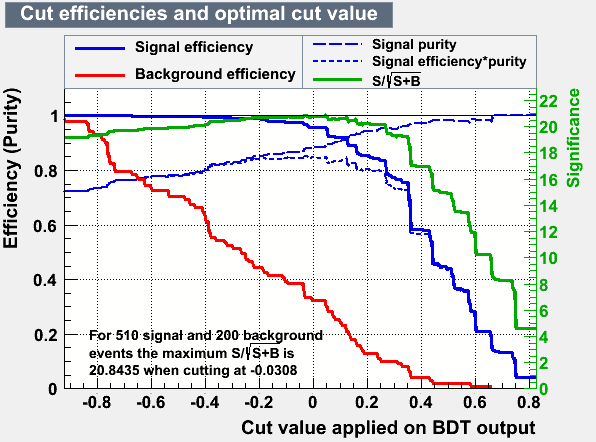
Table I
| pT | #signal, #background | Optimal-cut | S/sqrt(S+B) | Nsig | Nbkg | EffSig | Effbkg |
| 7-10 | 2254, 20352 | -0.121 | 26.31 | 1433 | 1534 | 0.636 | 0.075 |
|
10-15 |
836, 3132 | -0.064 | 20.61 | 670 | 386 | 0.80 | 0.123 |
| 15-20 | 510, 200 | -0.031 | 20.84 | 493 | 67 | 0.97 | 0.33 |
| >20 | 116,28 |
Difficult to model because of limited statistics |
Table 2 : BDT Setup
| pT | NTrees | MaxDepth | AdaBoostBeta | nCuts | |
| 7-10 | 120 | 1 | 0.70 | 50 | |
| 10-15 | 120 | 1 | 0.695 | 50 | |
| 15-20 | 120 | 1 | 0.6 | 8 | |
Groups:
- sdhamija's blog
- Login or register to post comments