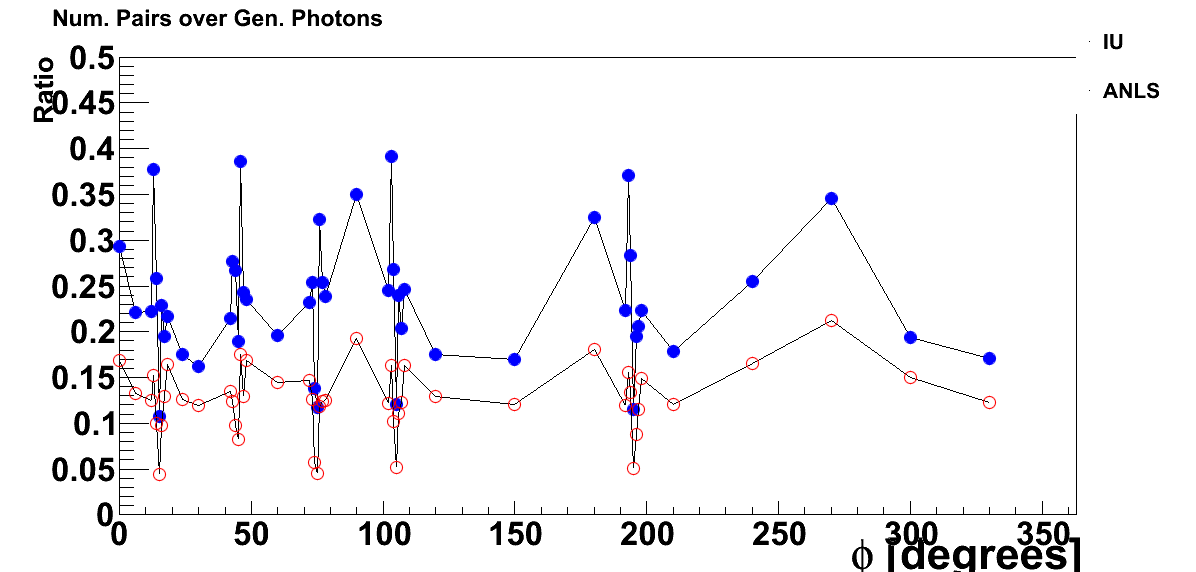
Candidate Pairs from Single Gammas vs Phi
Figure 7 of my Dec. 12, 2011 blog Azimuthal Angle Studies has been updated to additionally include the results from the ANLS algorithm. The plot should also be compared with Figures 3 and 7 of today's earlier blog "Comparison of EEMC Cluster Finding Methods: IU vs. ANLS". The MC data is obtained by generating single photons with p_T near 10 GeV and eta near 1.5. Each run has the phi value in a small region.

ANLS is red, open circles; IU algorithm is blue, filled circles. Note, with the exception of the one unusually high IU point near the crossed sector boundaries, the general shape of both methods are the same. The ANLS algorithm always has less pairs and thus less background. The cyclic pattern at the middle of the sector boundaries is also seen in the preshowers (see Azimuthal Angle Studies) and is thus due to material. The strangly high points near the sector boundaries are artifacts of the IU clustering algorithm. Thus, the phi dependence is now generally understood, although some work could be done in making the statements more specific (i.e. identifying the material causing the pattern, or identifying what about the IU clustering algorithm causes the strangely high spike).
- sgliske's blog
- Login or register to post comments
