Mass Spectrum of Converted Gammas
On the EMC2 / photon analysis phone meeting of Nov. 8th, Scott Wissink suggested that a feature of a mass plot may be due to converted gammas. This blog readdresses this issue, in the context of comparing the ANLS vs. IU algorithm.
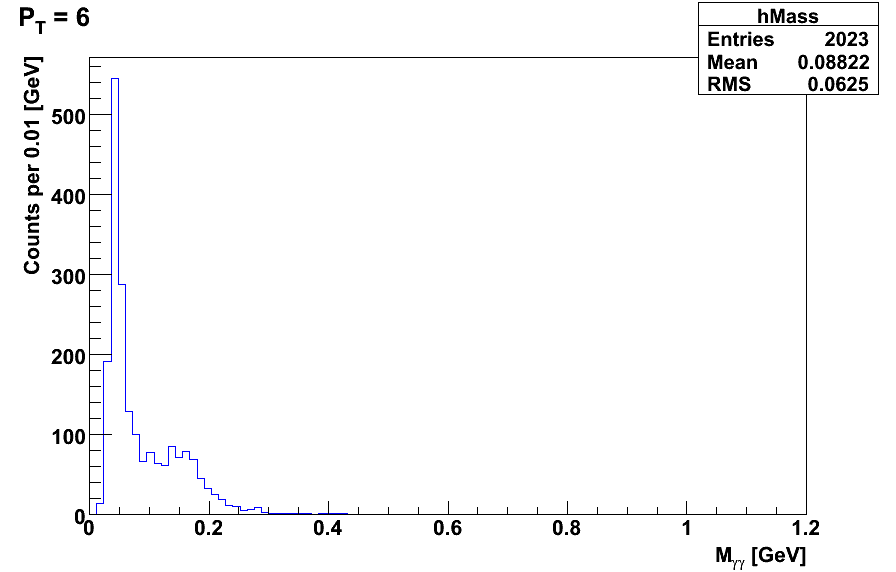
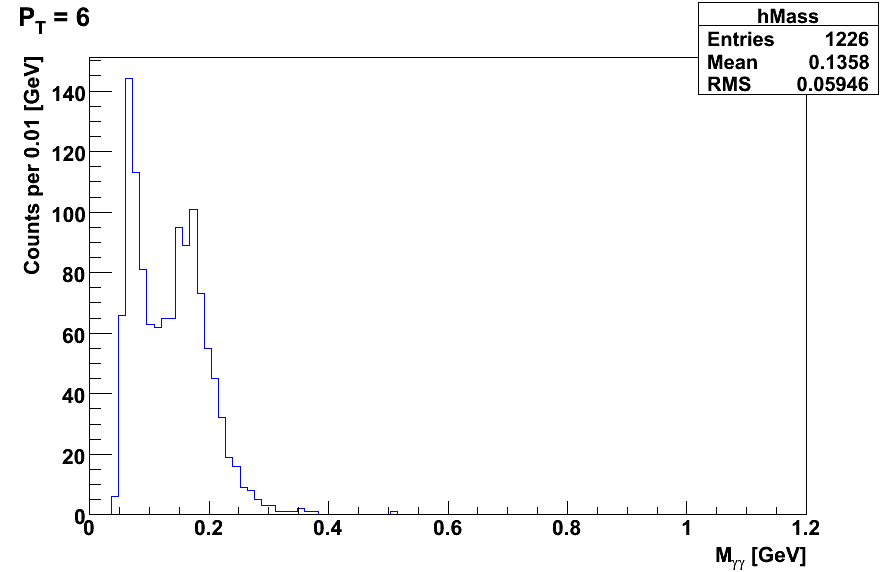
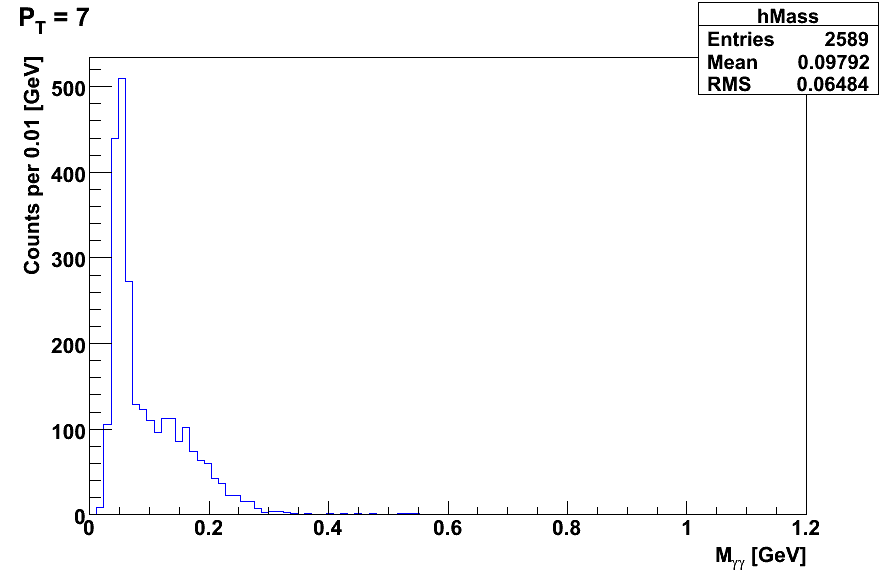
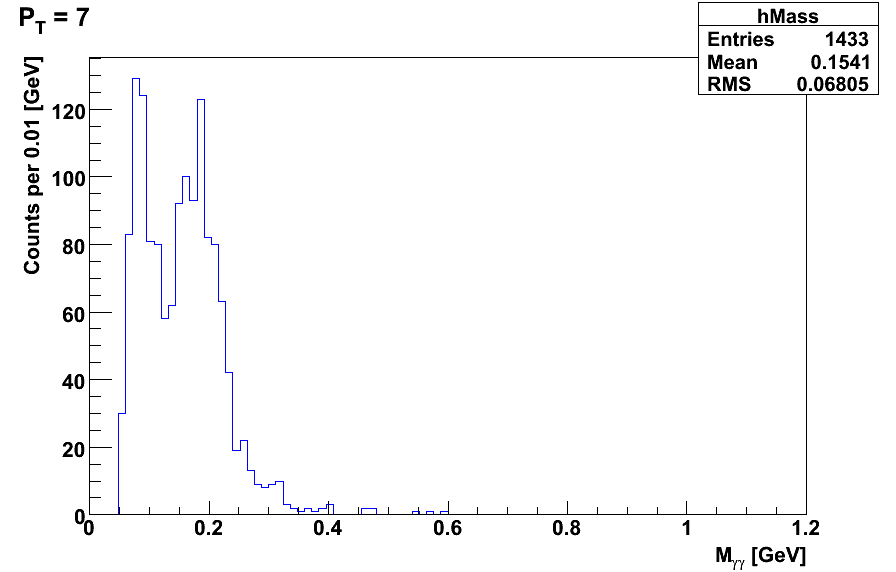
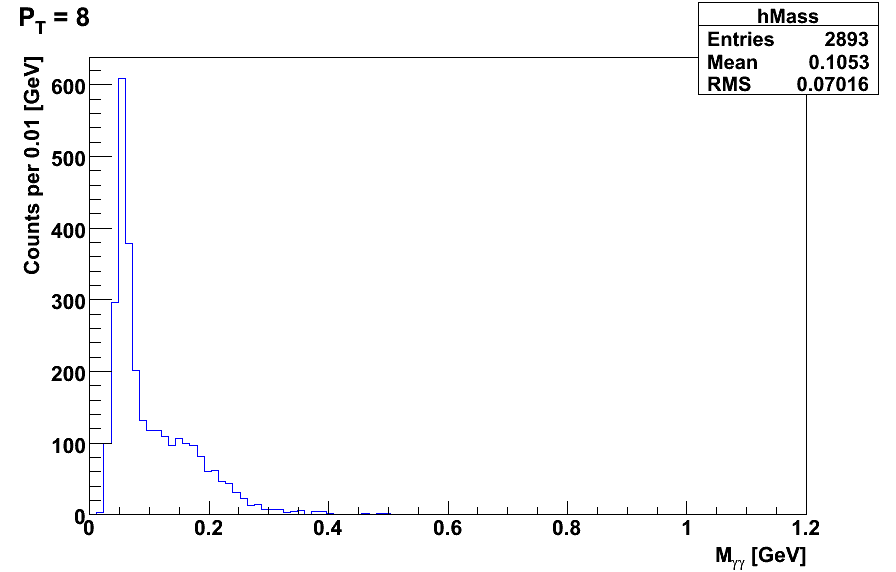
The following plots were made by generating 10,000 single photons, with eta near 1.4, phi near 0 degrees, and pT near 6, 7 or 8. These values were chosen to roughly correspond with the plot shown on slide of this talk of Scott's. The distribution of the invarient mass of candiate pairs meeting all pi0 cuts (except the invarient mass cut) are shown below. The left panels represent results using the IU algorithm, the right panel results from using the ANLS algorithm. The first row is for P_T = 6, second row P_T = 7, and third row P_T = 8. Note the difference in verticle scale in the different plots.
.gif)
While both algorithms produce a low mass peak, the number of statistics in the low mass peak is much smaller in the ANLS algorithm, by a factor of roughly 3 to 5. In the IU plots it is difficult to distinguish between a possible shoulder to the low mass peak and a possible peak due to conversions, since the low mass peak dominates the spectrum. Using the ANLS algorithm, it is possible to see two peaks, interpreted as the low mass peak (due to the algorithm splitting a single photon into a pair) and the peak near the pi0 mass (due to photons converting into e+ e- pairs). The plots from the ANLS algorithm were fit to a Gaussian distribution in the restricted range of 0.12 to 0.25 GeV. The results of the fits were:
| Generated pT | Mean of Gaus. | Sigma of Gaus. |
|---|---|---|
| 6 GeV | 0.162 GeV | 0.0042 GeV |
| 7 GeV | 0.176 GeV | 0.0041 GeV |
| 8 GeV | 0.182 GeV | 0.0066 GeV |
For reference, the pi0 mass peak is at 0.135 GeV and fits often yeild a sigma of about 0.003 GeV.
- sgliske's blog
- Login or register to post comments
