EEMC pi0 Peak Pos
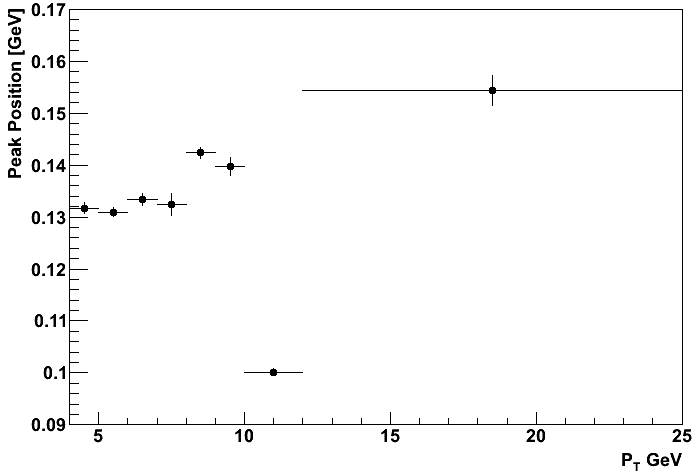
Here's just a quick plot of the pi0 mass position vs pT.
The background subtraction is done via templates, and then the "signal" (for this blog) is defined as the histogram from data (currently 51 runs) minus the two background templates (with weights set by the fitting procedure). The "signal" is then fit to a skewed Gaussian (i.e. the sigma has an extra term proportional to the invariant mass). The mean of the skewed Gaussian is plotted below. Note: the first plot has the fit for the skewed Gaussian from 0.1 to 0.3 GeV, while the second plot is for 0.115 to 0.3 GeV.
Lower Edge of Skewed-Gaussian-Fit-to-Signal at 0.1 GeV

Lower Edge of Skewed-Gaussian-Fit-to-Signal at 0.115 GeV

Conclusions
A significant difference is seen based on whether to set the low edge at 0.1 GeV or 0.115 GeV. In this region, the low mass shoulder (which is is not modeled well in the Monte Carlo) could certainly effect the peak position in a pT dependent way.
- sgliske's blog
- Login or register to post comments
