Change in A_LL: Oct 11th vs Dec 14th
It was noted in a blog on Dec. 14th that the A_LL plots had not been updated since the plots shown at the PWG Spin meeting on Oct 11th. The following is a further analysis of the difference between the two plots.
The code which computes A_LL (as of when the plots were made) does not save the numbers, but rather outputs the numbers to the screen and saves the .eps file for the plot. To get the number again for the plots for the two dates, I need to thus regenerated the plots from the correct input files. I have tried to match the input files, and to verify this, here are the plots generated today using the presumed correct inputs (which correspond exactly with the numbers in the table later in this blog.
Note: the Oct 11th plot uses only 20% of the available luminoscity (Dec. 14th ususes all). The threshold for the simulated trigger (for both data and Monte Carlo) was 5% lower for the Oct 11th plot than it was for the Dec. 14th plot (4.0 & 5.7 GeV vs 4.2 and 6.0 GeV for ht and tp, respectively).
The overall reduced chi^2 is 0.63. If one uses only the old statistical uncertainty, the reduced chi^2 is about 2. Even though the "message" of the plots are significantly different, we see that the new result is quite consistent with the old result.
Note: the statistical uncertainty has gone down. Noticing this in the table, I went back and checked the number of runs and lumi for each plot.
It is not suprising that using 5 times the statistics causes a what seems like a significant shift in the central values, but still consistant within uncertainties. The trigger thresholds also have changed, but such a shift due to only the trigger thresholds was unexpected (though not inconceivable).
One can see the systematic uncertainty has also reduced significantly. To quantify this change, the following table lists seperately the contribution from source to the overall systematic uncertainty. Two sources of systematic uncertainty were used for the plots:
One can see that both systematic uncertainties have been reduced, i.e. the signal fraction has been determined to a higher precision in the "new" case (decreased error bars on the data allow for a more precise fit) and the resulting residuals of the fits are smaller (better fits--could be due to both the increase in statistics providing a better fit or due to the change in trigger threshold improving the data/MC comparison).
The code which computes A_LL (as of when the plots were made) does not save the numbers, but rather outputs the numbers to the screen and saves the .eps file for the plot. To get the number again for the plots for the two dates, I need to thus regenerated the plots from the correct input files. I have tried to match the input files, and to verify this, here are the plots generated today using the presumed correct inputs (which correspond exactly with the numbers in the table later in this blog.
Note: the Oct 11th plot uses only 20% of the available luminoscity (Dec. 14th ususes all). The threshold for the simulated trigger (for both data and Monte Carlo) was 5% lower for the Oct 11th plot than it was for the Dec. 14th plot (4.0 & 5.7 GeV vs 4.2 and 6.0 GeV for ht and tp, respectively).
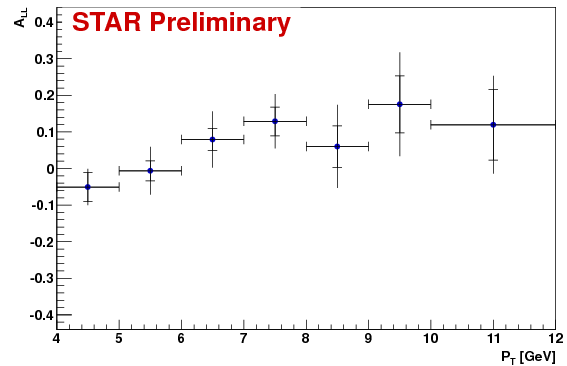
Old (Oct 11th) plot
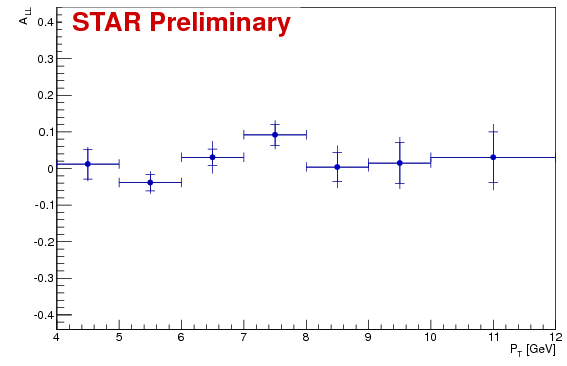
New (Dec 14th) plot
Statistical Comparison
To check for consistency, one can compute the chi^2 per bin, or the overall reduced chi^2. However, the uncertainties are correlated. One can ask, are the new central values consistent with the old values within the total uncertainty of the old values. This will tell us whether the procedure of estimating uncertainties accounts for this possible change. This is consistent with assuming the "new" value is the "true" value and seeing if the "old" value (with its uncertainties) is consistant with it. The following table shows the A_LL values, the statistical uncertainty, and the combined uncertainty.| OLD | NEW | |||||||
| pT bin | A_LL | Stat. Uncert. | Total Uncert. | A_LL | Stat. Uncert. | Total Uncert. | delta A_LL | chi^2 per bin |
| 4-5 | -0.051 | 0.039 | 0.050 | 0.012 | 0.041 | 0.047 | 0.06 | 1.57 |
| 5-6 | -0.007 | 0.027 | 0.066 | -0.039 | 0.023 | 0.031 | -0.03 | 0.24 |
| 6-7 | 0.079 | 0.030 | 0.077 | 0.030 | 0.023 | 0.044 | -0.05 | 0.40 |
| 7-8 | 0.129 | 0.039 | 0.075 | 0.092 | 0.029 | 0.040 | -0.04 | 0.24 |
| 8-9 | 0.060 | 0.057 | 0.114 | 0.004 | 0.040 | 0.058 | -0.06 | 0.24 |
| 9-10 | 0.175 | 0.078 | 0.142 | 0.015 | 0.056 | 0.071 | -0.16 | 1.28 |
| 10-12 | 0.119 | 0.097 | 0.134 | 0.031 | 0.069 | 0.090 | -0.09 | 0.44 |
The overall reduced chi^2 is 0.63. If one uses only the old statistical uncertainty, the reduced chi^2 is about 2. Even though the "message" of the plots are significantly different, we see that the new result is quite consistent with the old result.
Further Comparison
Note: the statistical uncertainty has gone down. Noticing this in the table, I went back and checked the number of runs and lumi for each plot.
Old plot: 72 runs, L = 1 pb^-1
New plot: 301 runs, L = 5 pb^-1
It was noted in the warning on the Oct 11th blog that only about 1/3 of the runs were used. We all seem to have forgotten about that warning. :) However, asumming the statistical uncertainty scales like sqrt(n), we see the combination of more runs but higher threshold has has resulted in almost the same "effective" number of events in the lowest pT bin, while in the highest pT bin, the effective n is only about 2. While total lumi has increased, the tighter cut also has a significant impact in the number of pi0 candidates.
It is not suprising that using 5 times the statistics causes a what seems like a significant shift in the central values, but still consistant within uncertainties. The trigger thresholds also have changed, but such a shift due to only the trigger thresholds was unexpected (though not inconceivable).
One can see the systematic uncertainty has also reduced significantly. To quantify this change, the following table lists seperately the contribution from source to the overall systematic uncertainty. Two sources of systematic uncertainty were used for the plots:
- Fit Params: The uncertainty on A_LL due to the propaged uncertainty on all the fit parameters from both fits (fitting template shapes to MC and fitting the weights of the shapes using data) parameters in template functions, weigfits and To quantify this,
- Fit Res: The uncertainty on A_LL propagated from fitting of residual (in the peak region) to a constant, setting an error on the number of pi0 to the constant times the bin width, propagating the uncertainty to the A_LL values.
| OLD | NEW | ||||
| Stat. | Fit Params. | Fit Res. | Stat. | Fit Params. | Fit Res. |
| 0.039 | 0.024 | 0.020 | 0.041 | 0.006 | 0.023 |
| 0.027 | 0.034 | 0.049 | 0.023 | 0.015 | 0.014 |
| 0.030 | 0.040 | 0.059 | 0.023 | 0.020 | 0.032 |
| 0.039 | 0.055 | 0.032 | 0.029 | 0.024 | 0.014 |
| 0.057 | 0.086 | 0.048 | 0.040 | 0.033 | 0.026 |
| 0.078 | 0.089 | 0.079 | 0.056 | 0.039 | 0.020 |
| 0.097 | 0.083 | 0.040 | 0.069 | 0.048 | 0.033 |
One can see that both systematic uncertainties have been reduced, i.e. the signal fraction has been determined to a higher precision in the "new" case (decreased error bars on the data allow for a more precise fit) and the resulting residuals of the fits are smaller (better fits--could be due to both the increase in statistics providing a better fit or due to the change in trigger threshold improving the data/MC comparison).
Conclusions
The plots are indeed statistically consistant. The old plot uses only 20% of the luminoscity compared with the new plot. Additionally, the trigger thresholds were raised for the newer plot. The major shift is thus understood as an effect of increasing the statistics and (most likely a lesser effect) the change in the trigger thresholds.Groups:
- sgliske's blog
- Login or register to post comments