Raw A_LL vs Mass
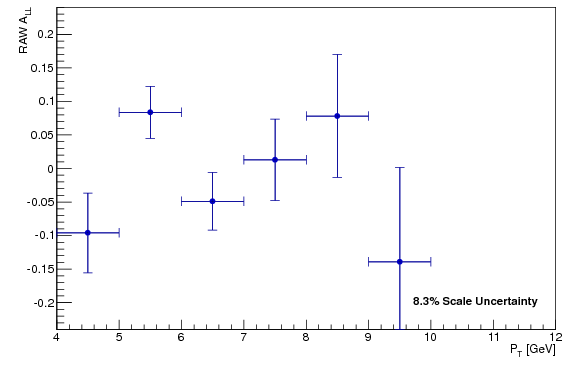
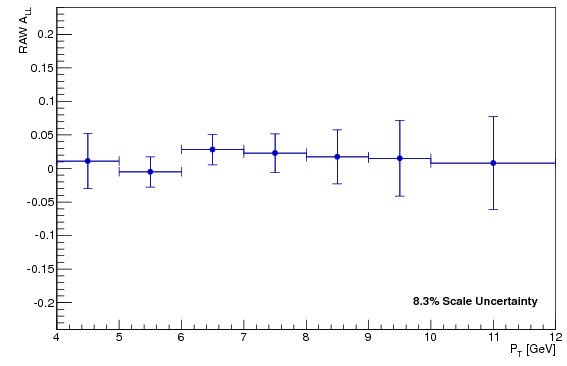
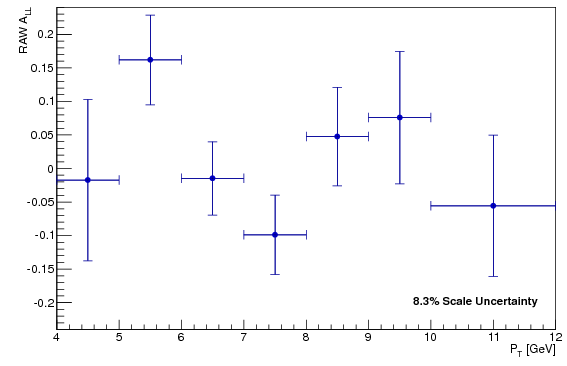
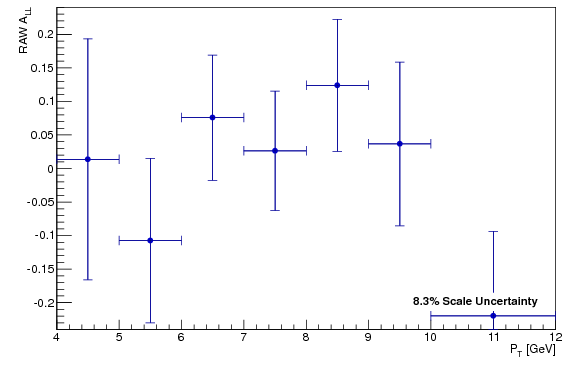
I've computed the A_LL using the raw (non background subtracted) number of pi0 candidates, in four different mass regions:

The last point is off scale, and is

Fitting to a constant

Fitting to a constant:

Fitting to a constant:
- Low mass: 0-0.1 GeV
- Peak: 0.1-0.2 GeV
- Above peak: 0.2-0.35 GeV
- High mass: 0.35-0.5 GeV
Comment on expected backgrounds
There are several different backgrounds. The prodimant ones are considered to be:- gamma -> e+ e- (not too close to the EEMC face) and make the pair from the e+ e- (peaked in shape, with mean slightly above the pi0 peak, and extending across most of the mass range)
- combinatorics, including combinations with leptons from photon conversion (generally a rather flat and broad distribution, extending across most of the mass range)
- Low mass, due to single clusters reconstructed as two clusters (peaked at low mass, extending slightly into the pi0 peak region, but with a definite max value)
- Low mass, gamma -> e+ e- close to the EEMC face (small seperation distance implies localized at low mass--more details forthcoming)
Low Mass (0 to 0.1 GeV)

The last point is off scale, and is
-0.306327 +/- 0.181745
Fitting to a constant:
Chi2                      =      13.1571
NDf                       =            6
p0                        = -0.000638024   +/-   0.0225805
consistant with zero -0.0282555
Mass Bin 2 (0.1 to 0.2 GeV)

Fitting to a constant
Chi2                      =      1.22369
NDf                       =            6
p0                        =    0.0139913   +/-   0.0120544
consistant with zero .
Mass Bin 3 (0.2 to 0.35 GeV)

Fitting to a constant:
Chi2                      =      9.86854
NDf                       =            6
p0                        =    0.0104235   +/-   0.0278236
consistant with zero 0.374627
Mass Bin 4 (0.35 to 0.5 GeV)

Fitting to a constant:
Chi2                      =      6.15271
NDf                       =            6
p0                        =     0.011753   +/-   0.0418064
consistant with zero 0.281129
Conclusions
While there is a significant amount of noise in the off peak data points (due to limited statistics), all off peak points are consistant with zero to a high degree with no obvious systematic trends. The fits to a constand are at most 0.4 sigma from zero, with the reduced chi^2 of the fits being between about 1 to 2.2. There is no apperent asymetry in the background. The peak has a stronger indication of a signal, but the fit to a constant is still only 1.2 sigma from zero--3 times the maximum value of peak, but still not a statistially significant indication of an asymmetry.Groups:
- sgliske's blog
- Login or register to post comments
