EEMC pi0 Efficiency/Migration Study
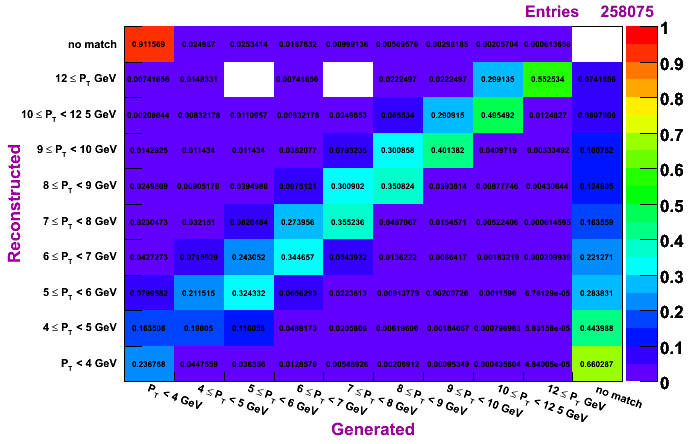
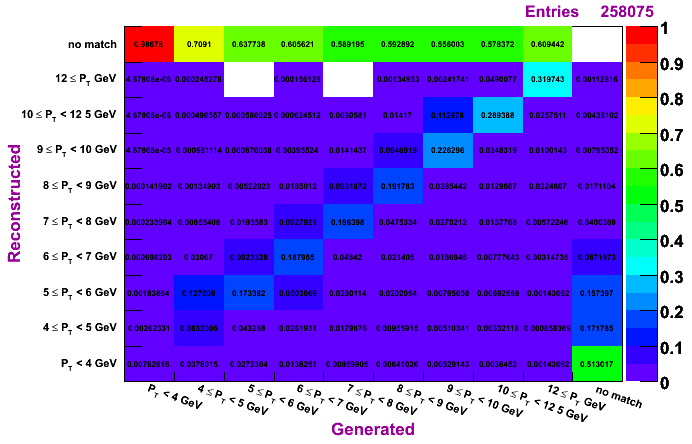
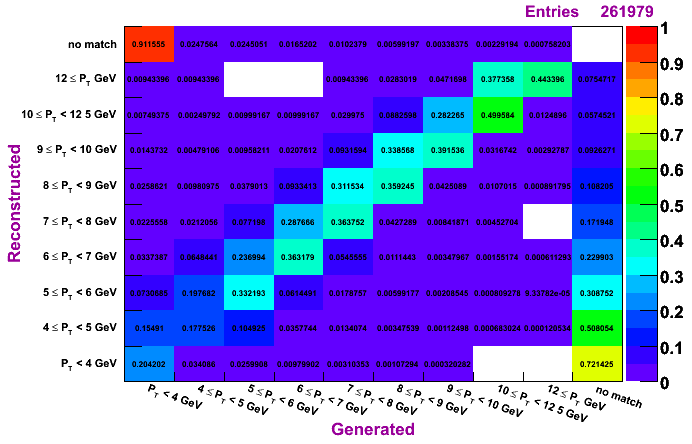
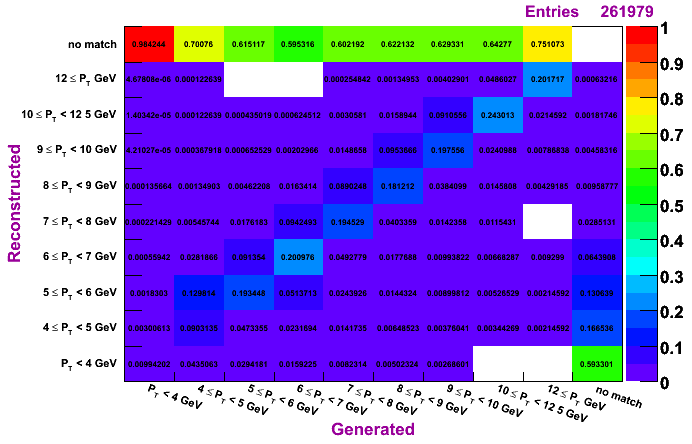
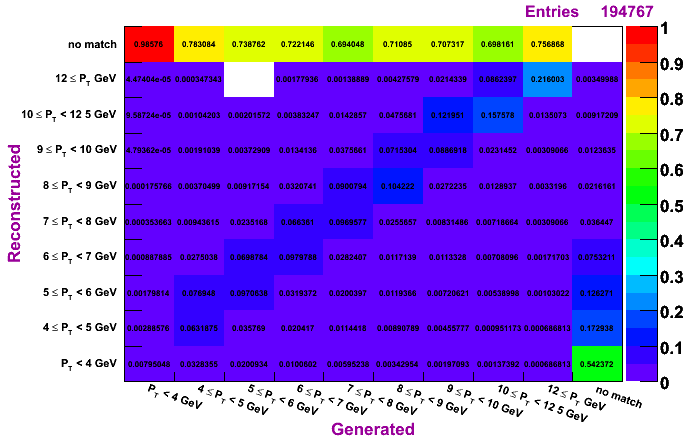
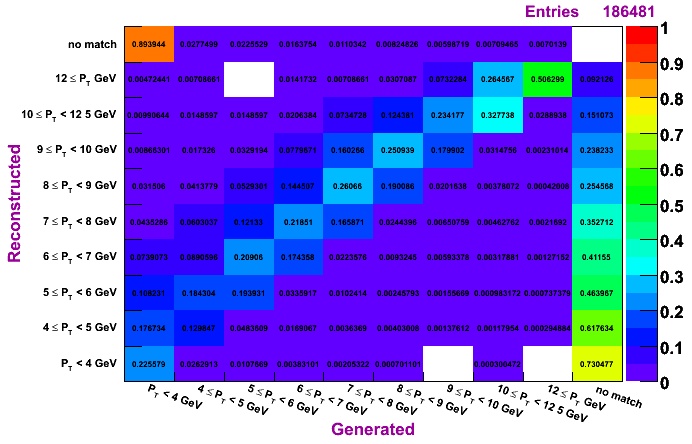
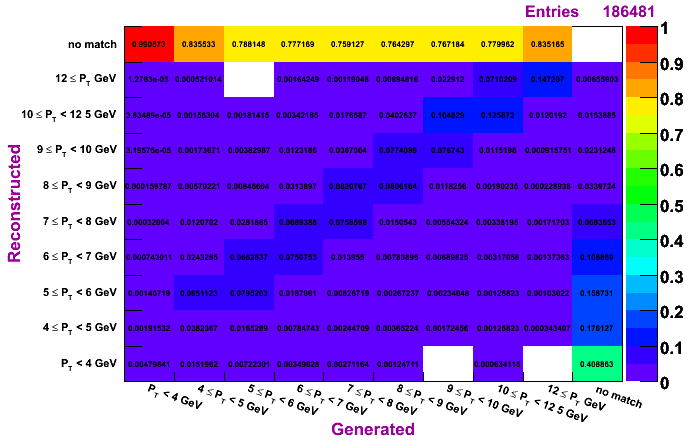
Plots are shown for generated vs. reconstructed pT, which shows both the efficiency and the pT migration. Results are shown for clustering methods IU, Morhac, and TSP.
Filling the Matrix
The bins are defined according to the pT value,
- 0-4 GeV
- 4-5 GeV
- 5-6 GeV
- 6-7 GeV
- 7-8 GeV
- 8-9 GeV
- 9-10 GeV
- 10-12 GeV
- >12 GeV
- no match
If more than one reconstructed track is associated with a generated pi0, or if several reconstructed tracks have momentum in nearly the same direction (but there was no pi0 generated in that direction), and entry is added for each of the (generated, reconstructed) pairs, but weighted by 1 over the number of pairs. For example:
- Suppose a pi0 with pT = 9.5 GeV is generated, but decays into photons with pT 5 and 4.5 GeV. Furthermore, assume the cluster finder falsely splits the 4.5 GeV photon into two clusters, with pT values of about 3.6 and 0.9. Three pairs would be reconstructed, with pT values near 8.5, 5.9 and 4.5. Three entires are made in the matrix, each with weight 1/3. The (row/reconstructed, column/generated) bins are (6,7), (3,7) and (2,7).
- Suppose a pi0 with pT = 9.5 GeV is generated, but one of the photons is absorbed in some material. There are no reconstructed candidate pi0s with momentum in the same direction as the generated pi0. The element (10,7) is filled with one entry, since there is no reconstructed match for the generated.
- Suppose a photon generated and converts in an e+e- pair. Suppose the e+e- pair is measured and appear as a 9.5 GeV pi0. The element (7,10) is filled, since there was no matching generated pi0.
Note: a cut is applied on the reconstructed candidate pi0 such that the mass falls within 0.085 and 0.19 GeV.
Matching Generated and Reconstructed
The previous IU method would associate a reconstructed pi0 candidate with a generated pi0 if the deltaR was smaller than 0.04, with
In my analysis, I associate the reconstructed candidate with the generated pi0 if the angle between the 3-momenta (denoted alpha) is less than 0.015 rad. If one were to project the pi0 momentum to determine the effective location on the end cap (at the distance of the SMD), this angle corresponds to an effective seperation of about 4.2 cm, independent of eta. For the deltaR cut, the effective seperation varies with eta. A table of some representative values of deltaR, and the corresponding angle between the 3-vectors (alpha), at three eta values are given in the following table.
| |
||
|---|---|---|
| 1 | 0.04 | 0.026 |
| 1.5 | 0.04 | 0.017 |
| 2 | 0.04 | 0.011 |
Data Source
I am using the qcd background Pythia files from production P10ii, using 2006 geometry, produced in 2011 for the prompt photon analysis. Files were generated in four pT regions: 4-6, 6-9, 9-15, and 15-35. These pT ranges do not correspond to the pT of the pi0s, however. Files generated at similar pT have about the same cross section, and so are combined without scaling by the cross section for each file. No attempt is made as of yet to combine the results from the different pT bins. For now, one should trust the region of the plot which most corresponds to the MC pT bin. It is planned to combine the runs across pT generation regions later. Note: no more than 50 runs of each pT bin are included in the following plots.
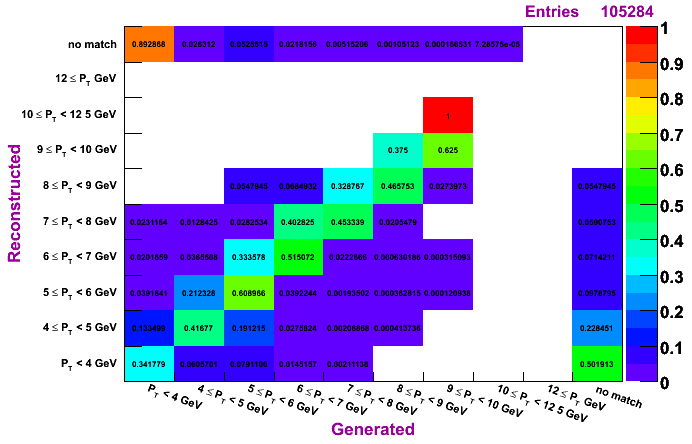
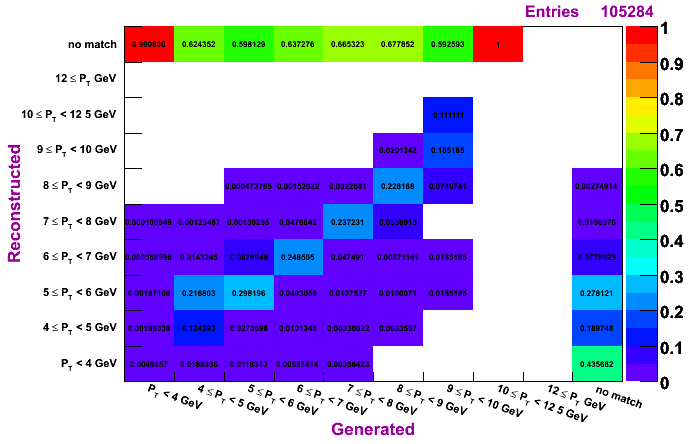
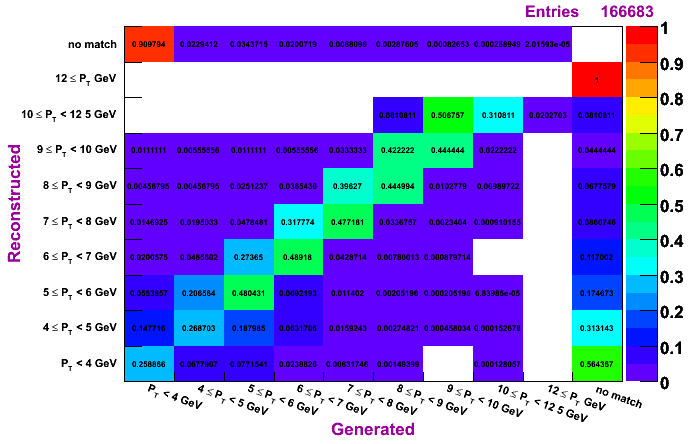
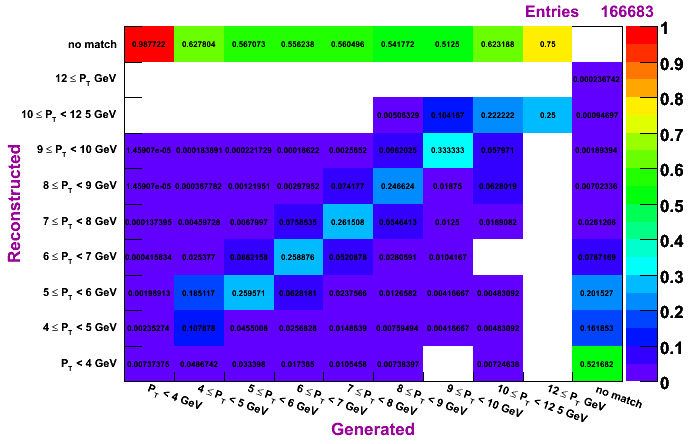
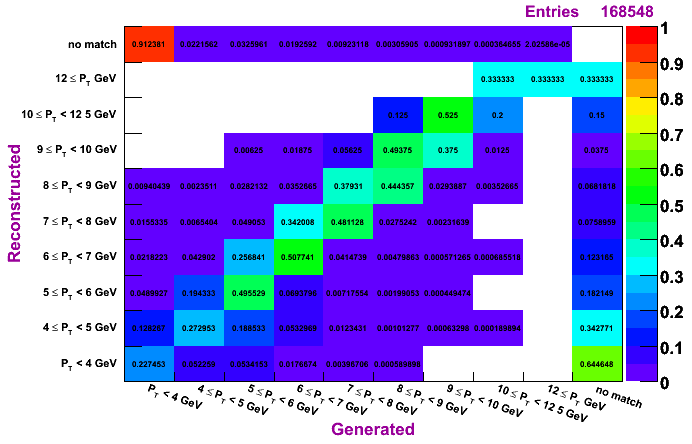
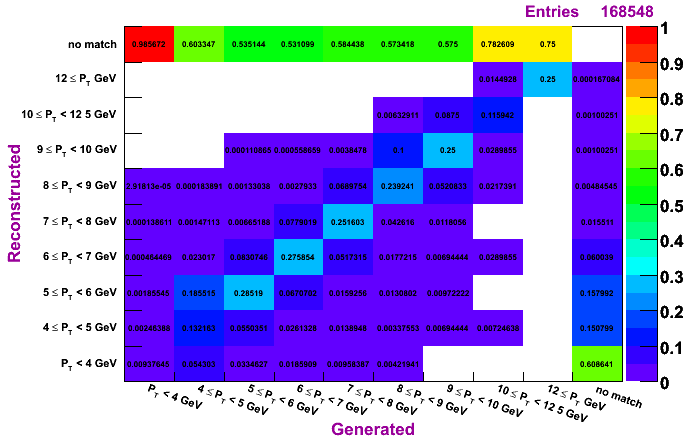
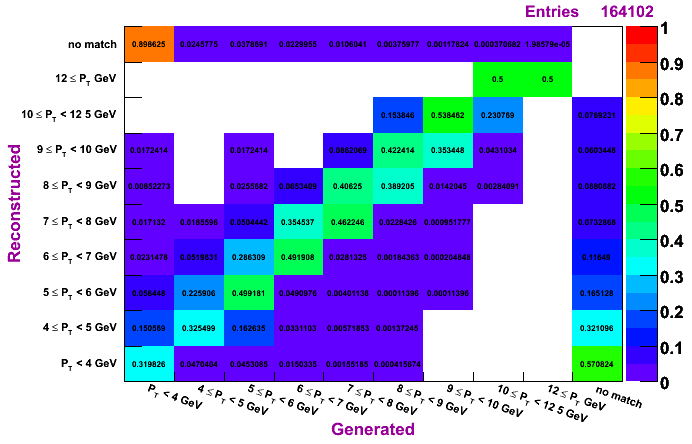
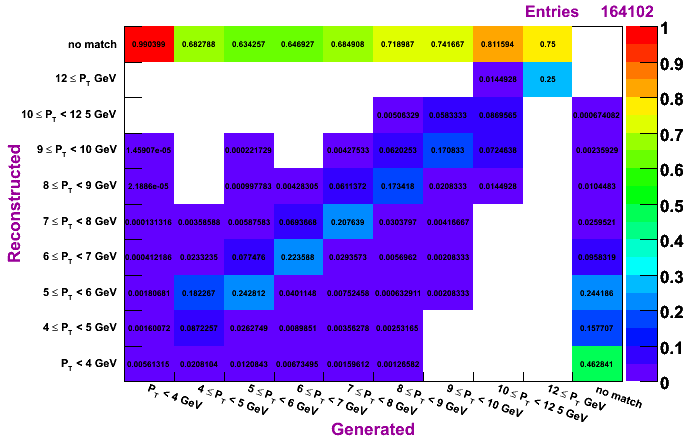
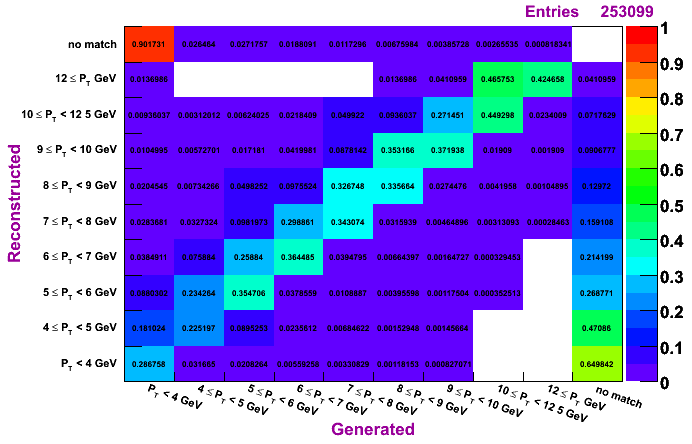
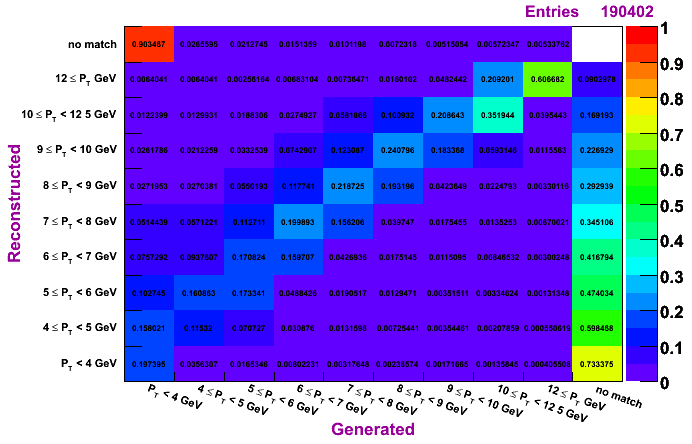
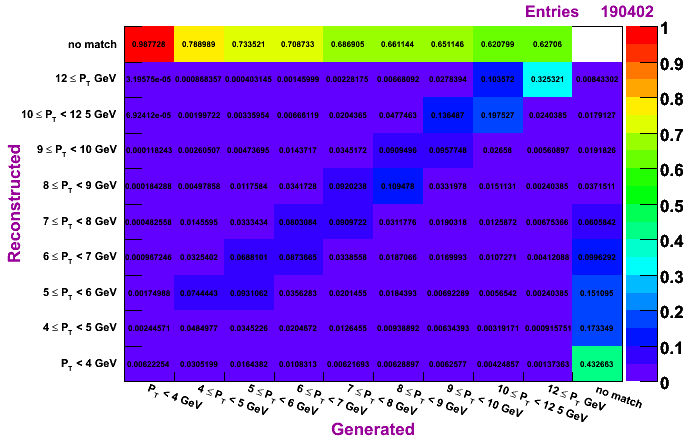
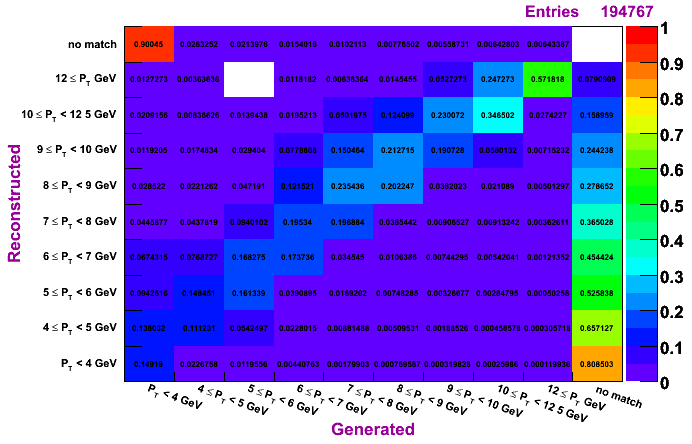
Results
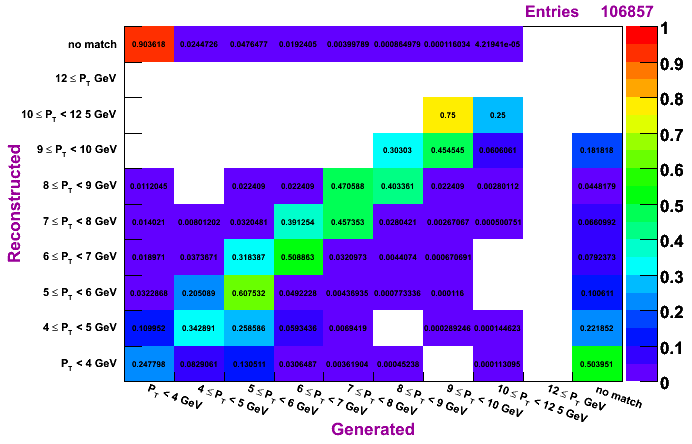
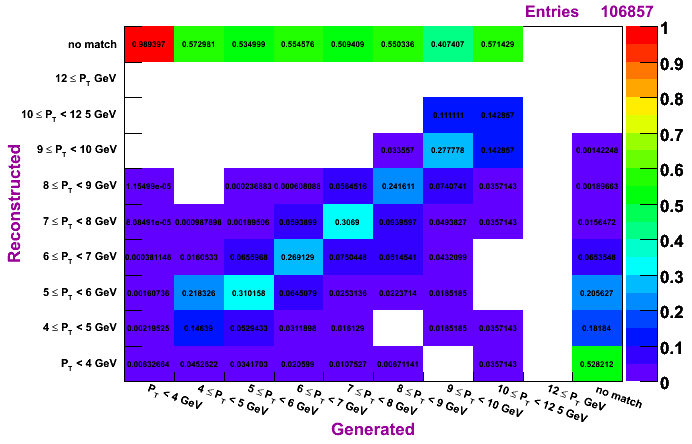
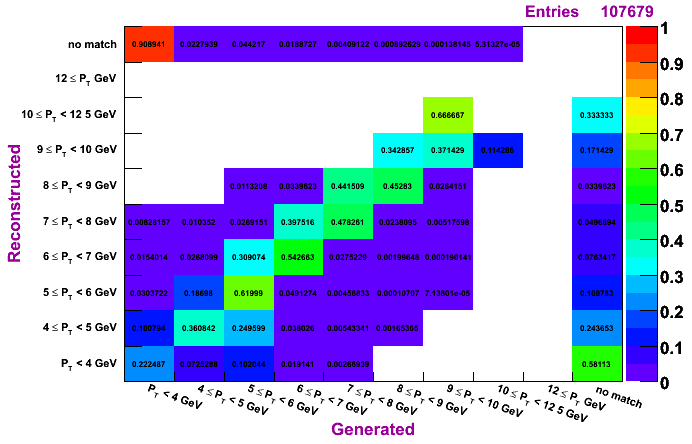
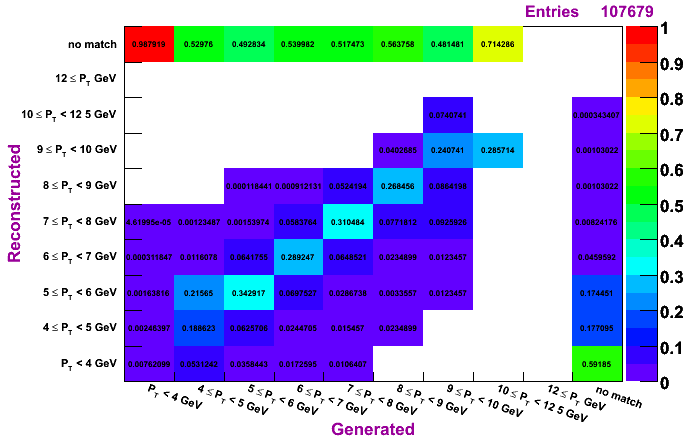
The plots on the left are normalized so that the sum across a given row is unity, while the plots on the right are normalized so that the sum along a given column is unity. To determine how much of a given reconstructed pT actually was generated in that bin, look to the plots on the left. To determine the reconstruction efficienty of a pi0 generated at a certain pT, look to the plots on the right (especially the top row, which shows the percentage, per pT bin, of pi0s which were generated and not reconstructed).
IU, MC pT bin 4-6 GeV
Morhac, MC pT bin 4-6 GeV
TSP, MC pT bin 4-6 GeV
IU, MC pT bin 6-9 GeV
Morhac, MC pT bin 6-9 GeV
TSP, MC pT bin 6-9 GeV
IU, MC pT bin 9-15 GeV
Morhac, MC pT bin 9-15 GeV
TSP, MC pT bin 9-15 GeV
.gif)
IU, MC pT bin 15-35 GeV
Morhac, MC pT bin 15-35 GeV
TSP, MC pT bin 15-35 GeV
Conclusions
The differences in the algorithms are not so apperent from these plots. The TSP does tend to have slightly higher purity but lower efficienty. The IU and Morhac methods seem quite similar.
Regardless of the method, it does seem a pT unfolding is needed. The fact that, for a given diagonal element, the entry right above is numerically close to the entry to the left of the given diagonal element (looking at the left set of plots, which are normalized horizontally), shows that ignoring the pT migration does not give terrible results. However, amount of pT bin migration shown in these plots suggests the need to do a true unfolding.
If the MC background estimates seem consistant with data, one could simultainiously unfold and remove background, as the farthest right column is effectively the background under the pi0 peak. However, if one cannot trust the MC simulation enough, then one would have to seperately deal with background.
- sgliske's blog
- Login or register to post comments