EEMc Pi0 Relative Photon Angle
Dave Underwood noted that the leptons from photon decay tend to be seperated much more in phi than in the radial direction, when looking at the 2D positions on the ESMD, due to bending in the magnetic fields. In contrast, the photons from pi0 decay should be uniform. While Dave investigated this using the mass computed in the u and v planes, herein I look at the angle beta, defined as the angle (all defined in just the xy plane) between the vector from the origin to the position of the higher energy photon and the vector from the position of higher energy photon to the position of the lower energy photon. 11 Runs from 2006 are analyzed in the following.
Formally, one can define
where x_1, x_2, y_1, y_2 are the x and y positions of the first (higher energy) and second (lower energy) photons at the SMD plane.
The following plots include the "basic" cuts of pi0 pT > 4 GeV, both photon energies > 3 GeV, the mass cut which is a function of dgg (from this blog), and for Morhac and IU algorithms, a requirement that dgg > 4 cm. First, let us take a look at the distribution of beta for each algorithm. The plots are presented in order IU, Morhac, TSP.
.gif)
.gif)
.gif)
The results for Morhac and TSP algorithsm are similar, while the IU algorithm is significantly different. All algorithms have a higher density region near +/- pi/2, which is where a higher density region due to conversions should fall. Near the sector centers, the strips are at 45 degrees from the phi of an incoming photon, and thus the peaks near beta = +/- 1/4 pi and beta = +/- 3/4 pi are due to the pi0 photons being reconstructed mainly along the strip direction. The other peaks, those near 0 and +/- pi, need further investigation. The big difference between IU and the other algorithms is most likely due to the fact that the other algorithms have most of the "signal" with du or dv = 0, while the IU algorithm has most of the "signal" with neither du nor dv = 0. Thus, the IU algorithm has the photons aligned with the strips much less often.
Next, the beta vs. mass distribution is presented, for the IU, Morhac and TSP algorithsm.
.gif)
.gif)
.gif)
The 2D distributions do not teach much more than the 1D beta distributions. There is some hint of the higher density region near +/- pi/2 extending to higher mass, which would be indicative of the pi0 candidates being from photon conversion.
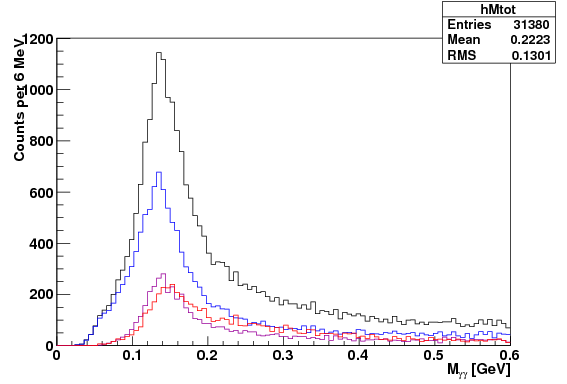
Lastly, we consider the invarient mass distribution in three regions: near beta = +/- pi/2 (designated red in the following), near beta = +/- 1/4 or +/- 3/4 pi (designated blue in the following), and near beta = 0 or +/- pi (designated purple in the following). Each of these regions are defined to be pi/4 wide. The mass distribution for each region is plotted in the designated color of the region, and the sum is plotted in black. Again, the plots are shown for each of the IU, Morhac, and TSP algorithms. Note, wrongly associating u and v clusters could offset beta by about pi radians, and thus there could be mixing between the red and purple regions. The blue region is most likely the purest signal.
.gif)
.gif)

While the red line looks a bit like one would expect from pi0 candidates from converted photons, it is difficult to make strong statements based on the data. This idea needs to be pursued in Monte Carlo data, to determine the efficacy a beta cut has on seperating conversions from true pi0s.
- sgliske's blog
- Login or register to post comments
