Tower E_T Plots -- limited Z range
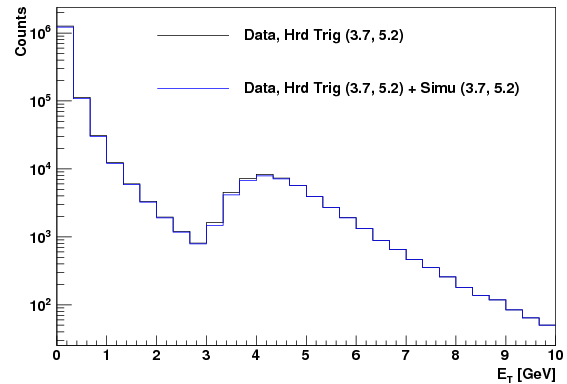
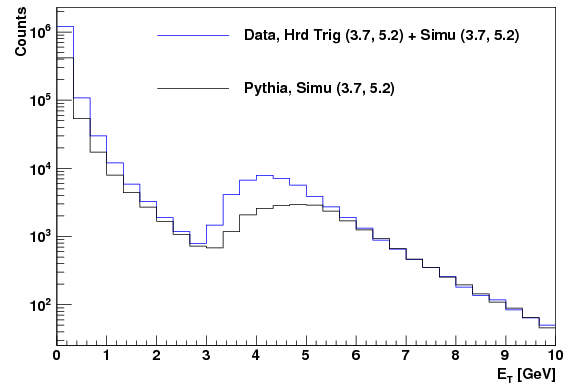
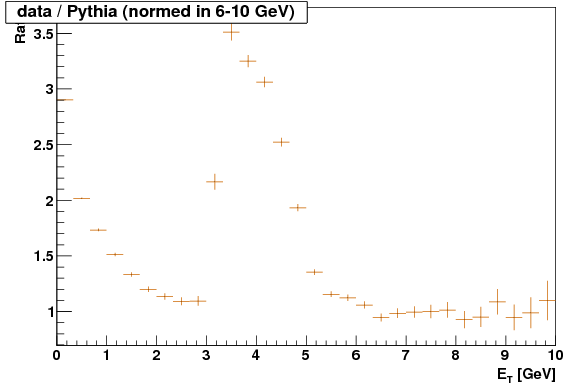
Per Steve T's suggestion, I limited the Z range to (-60,-30) for the tower E_T plots. I checked the entries in a few histograms to make sure the cut did anything--it did--but the following plots look qualitatively the same as those in the last E_T plot blog.

Groups:
- sgliske's blog
- Login or register to post comments