Tower E_T Plots & data/MC Comparison
Updates since last blogs:
- It was found that the L2 thresholds were varying on different dates than I though they were--the official trigger pages are apperently is only L0! :(
- Now, the simu trigger L2 thresholds are set to 3.9 GeV (HT) and 5.5 GeV (TP) and the L0 DSM values were set to 1 more than the highest values used in 2006
- Thus, both L0 and L2 are slightly above hardware levels and the L2 is above the Pythia filter level (3.8 GeV--before I was using 3.7!)
- Thus, same simu trigger for all data runs and for Pythia
- Some understanding related to the Et plots, detailed below
Tower ET plots
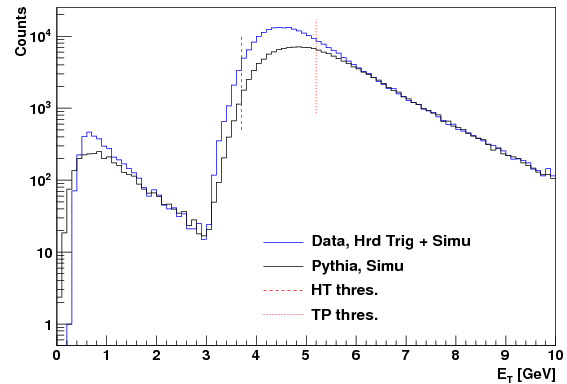
First, similar plots as shown before:
.png)
.png)
.png)
.png)
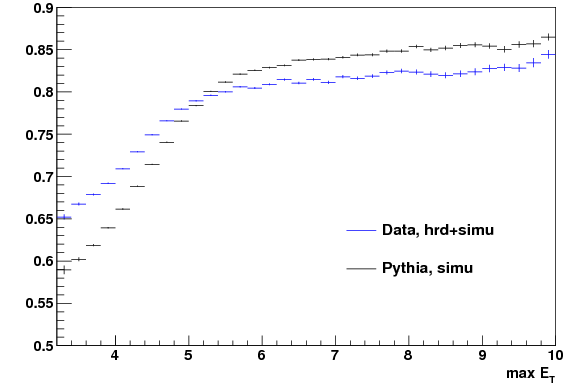
Note, the turn on point is now the same--a little over 3 GeV. To get clearer information, I decided to plot only the max ET per event, rather than all the tower ETs.
Again, we see the turn on at the exact same place in data and MC, as well as the leveling off in almost the same place in data and MC. This shows that the same thresholds are being applied in both cases. There is still a difference in the turn-on rates for data vs MC. One cause for this could be the "shower" shapes in the towers, i.e. the ratio of the ET of the max ET tower to the summed ET in the 3x3 patch surrounding (and including) this tower.
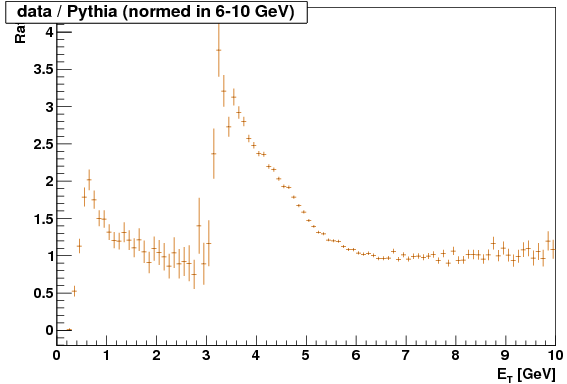
And so we see there are significant differences in the size of the "showers" in data vs. MC, not only per any one given ET, but also with a complex structure, i.e. the shapes are somewhat different. In the 3-5.5 GeV range, where the trigger is shaping the distribution, we see that data (within the trigger) has a narrower shower shape, although this changes at about the point where the trigger no longer is influencing the shapes. Note: the narrower shape (i.e. higher ratio on the above plot) would cause less data to pass the trigger (higher ratio => less HT energy => less likely to pass HT threshold). Thus the trigger efficiency (estimated from MC) would be higher than it ought to be, making the cross section lower than it ought to be. Unfortunatly, it is not obvious at this point how to correct for this effect, or to quantify the uncertainty. The relative uncertainty could be on the order of 2, based on the plot of data/MC for max ET.
Other Kinematic Distributions
See attachments. The comparison is now pretty good in all but the pT 4-5 bin, which is not used in the cross section (but still used in the asymetries, unless the SPIN group decides otherwise).
Trigger Efficiency
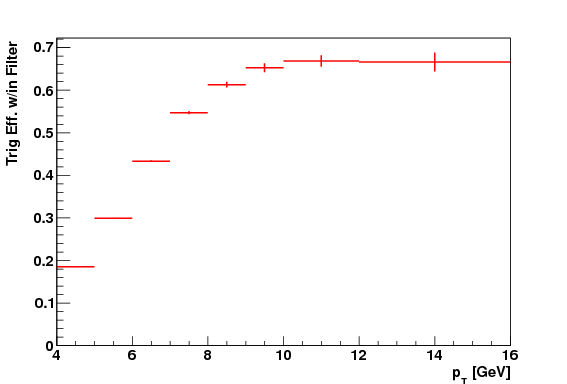
Note: the two lowest bins do not enter the calculation.
Conclusions
The cause of the differences in data vs. MC is mostly understood, or at least is pinned down to the difference in the shower shapes in the towers. While this does effect the trigger efficiency, it is proposed to show the cross section at the DNP with either
- The quantification that the uncertainty on the trigger efficiency is not fully included.
- A relative trigger uncertainty of 1/2 for the trigger bins (but not for all bins?)
Note: the spin asymetries are uneffected.
- sgliske's blog
- Login or register to post comments