Few thoughts on A. Hoffman's Analysis
Alan Hoffman's PhD analyzed 2006 data for cross section and A_LL for pi0s in the BEMC. It is often commented in the spin group that his agreement with theory (though unpublished) is better than the agreement between the theory curve and the published 2005 data. While the agreement is better, there are a few issues to be aware of that bring into question whether his better agreement is fortuitous or physical. In making the following comments, I do not want to discredit the great work that Alan did. However, we recognize that, as his work is unpublished, there may be a few remaining issues tor resolve before the analysis is at publication level. It'd like to highlight a few of these issues, and make sure we consider them when we think about how well the BEMC pi0 cross section matches the data.
Note, Alan does impose an effective fiducial cut, by requiring physical eta in +/- 0.7 (while the 2005 paper uses 0 < eta < 1), which may make his analysis a bit cleaner than the 2005 paper.
Following is the similar plot from my DNP talk:
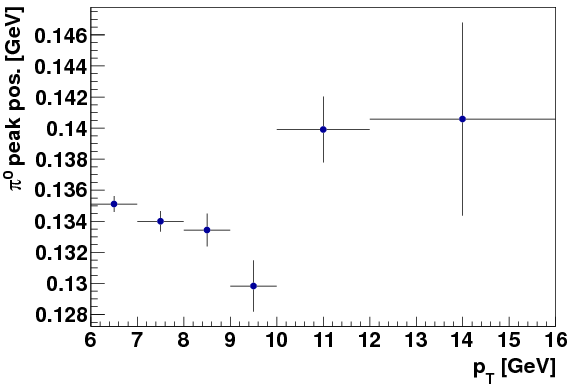
We see that the features causing a 40 MeV p_T dependance in the BEMC analysis is either different, under better control, or corrected in the EEMC analysis. Alan explains the pT dependence of his peak as being due to the pT resolution, yet does not ever make a plot of the pT resolution or the pT bin migration. He also does not apply any correction (unfolding) for bin migration. His test of this efficiency factor on page 79 verifies that the efficiency factor make the unfolded data matches the folded MC, and does not verify whether unfolding is needed. I agree with Alan that the 40 MeV shift (30%) in the mass peak position is most likely mainly due to the energy being off, as opposed to the opening angle or Z_gg. However, this feature most likely causes significant pT bin migration, for which he does not correct. One cannot trust his slope with great confidence as it is not unfolded.
For reference, I include the following plot from Frank S., who worked on the published 2005 result. The following is from this post. Note the partonic pT bins are not properly weighted in the following, according to Frank.

This may not be the most final version, but it is the one I could find. We see the 2005 analysis also has a paper also has about a 30MeV (22%) shift in mass peak vs. pT. From what I can tell, the 2005 analysis did not apply any unfolding either.
A concern is that the runs seem biased towards smaller number of pi0s per trigger. One would really need to see the plot with data having the one simulated trigger setting he used for the Monte Carlo to estimate the trigger efficiency. However, his points do seem systematically lower than the 2005 paper results, as seen on this plot from this page. Corresponding plot of number of pi0s within cuts (including simulated trigger) for our analysis are posted in this blog.
Note, Alan does impose an effective fiducial cut, by requiring physical eta in +/- 0.7 (while the 2005 paper uses 0 < eta < 1), which may make his analysis a bit cleaner than the 2005 paper.
Mass Peak Position and Unfolding
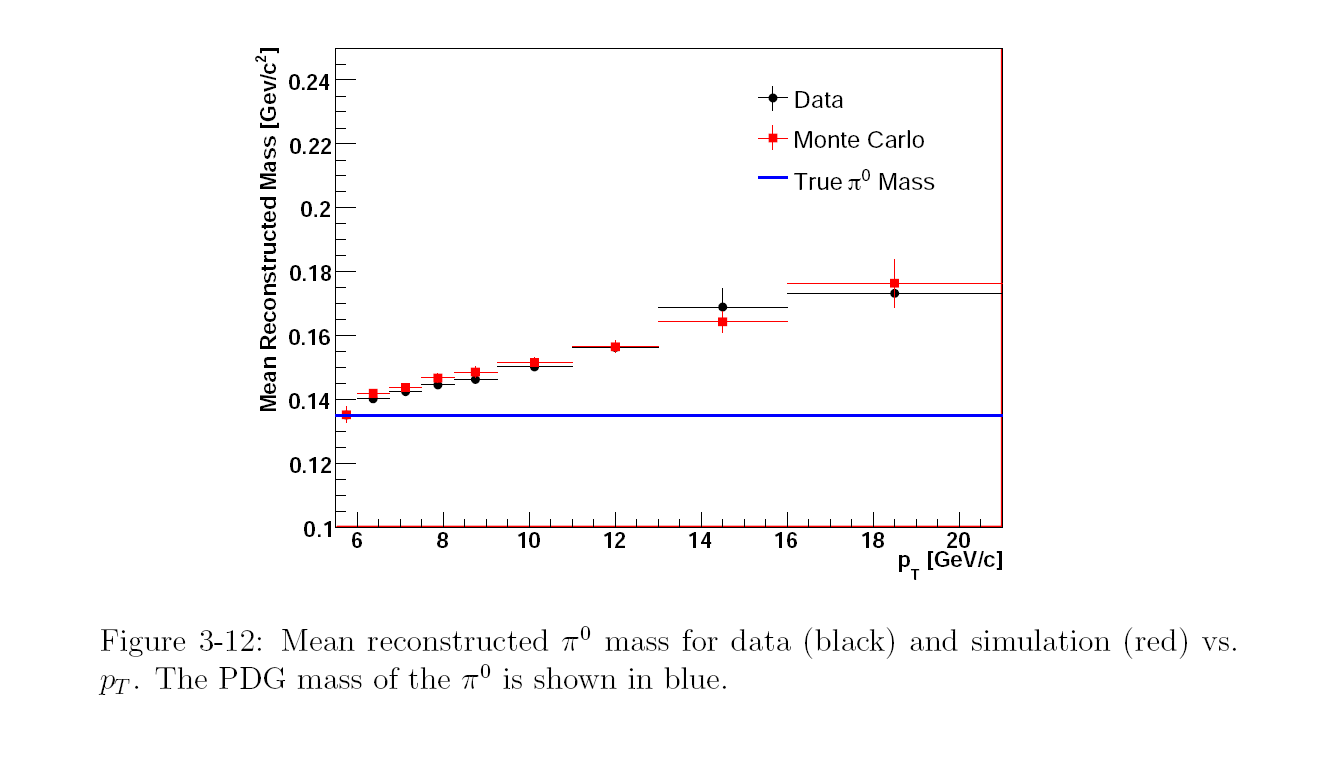
I reproduce Figure 3-12 from Alan's thesis:Following is the similar plot from my DNP talk:
We see that the features causing a 40 MeV p_T dependance in the BEMC analysis is either different, under better control, or corrected in the EEMC analysis. Alan explains the pT dependence of his peak as being due to the pT resolution, yet does not ever make a plot of the pT resolution or the pT bin migration. He also does not apply any correction (unfolding) for bin migration. His test of this efficiency factor on page 79 verifies that the efficiency factor make the unfolded data matches the folded MC, and does not verify whether unfolding is needed. I agree with Alan that the 40 MeV shift (30%) in the mass peak position is most likely mainly due to the energy being off, as opposed to the opening angle or Z_gg. However, this feature most likely causes significant pT bin migration, for which he does not correct. One cannot trust his slope with great confidence as it is not unfolded.
For reference, I include the following plot from Frank S., who worked on the published 2005 result. The following is from this post. Note the partonic pT bins are not properly weighted in the following, according to Frank.
This may not be the most final version, but it is the one I could find. We see the 2005 analysis also has a paper also has about a 30MeV (22%) shift in mass peak vs. pT. From what I can tell, the 2005 analysis did not apply any unfolding either.
Run Selection
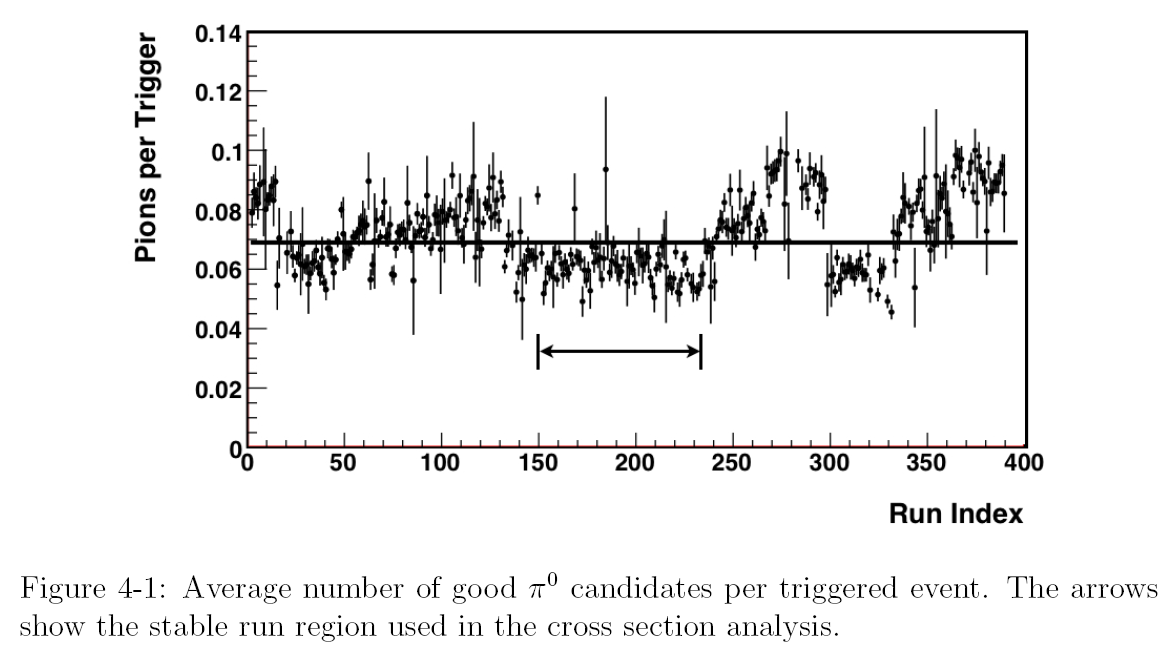
On page 72, Alan describes using only a subset of runs with stable running conditions for the analysis. However, the following page states that he also applies the simulated trigger, which, if set high enough, should wash out the differences in the hardware trigger. Alan provides Figure 4-1, which has the number of pi0 candidates per trigger. Since the figure shows strong fluctuations, it is assumed that either- the software trigger has not been applied for this plot or
- the software trigger thresholds are not raised high enough above the hardware levels and are not fixed for the whole dataset.
A concern is that the runs seem biased towards smaller number of pi0s per trigger. One would really need to see the plot with data having the one simulated trigger setting he used for the Monte Carlo to estimate the trigger efficiency. However, his points do seem systematically lower than the 2005 paper results, as seen on this plot from this page. Corresponding plot of number of pi0s within cuts (including simulated trigger) for our analysis are posted in this blog.
Conclusions
Two major issues are:- No unfolding--cannot put too much confidence in the slope. Applies to BEMC analysis of both run 5 and run 6 data sets
- Choice of runs may be biased--cannot put too much confidence in the overall normalization. Applies to BEMC analysis of run 6 data set, and shift can be seen between 2005 and 2006 results.
Groups:
- sgliske's blog
- Login or register to post comments