Vertex Z Acc/Rej
It was suggested to try weighting the Pythia sample in order to have it match the vertex distribution.
Procedure for Acceptance/Rejection
Introducing weights for the Monte Carlo would involve a fair amount of code restructure. Instead, it was decided to use an acceptance/rejection method using the weights, so that the result could be stored in trees and that other code would not need any modification (only to be told which EEmcTrees to use). The procedure is
- Determine the vertex distribution for data and Monte Carlo, per pT bin
- Reduce the number of bins, and do a little smoothing to remove noise
- Normalize the Monte Carlo to have the same integral as the data histogram.
- Note: will use linear interpolation between bins to determine the "height" at any Z position for each of the data and MC Z-vertex distribution histograms
- Loop over all pi0 canidates in the simulation
- Set the weight to (data hist interpolated value at the Z of the vertex) / (Monte Carlo hist interpolated value at the Z of the vertex)
- Through a random number u
- Reject the pi0 candidate if u > weight / maxWeight
Note: the max weight is set to 1.5. This is above the weights for about 90-95% of the pi0 candidates, and allows for the rejection method to only reject about 35% of the statistics. A higher "max weight" could be picked, but this would reduce the overall statistics more. This chose may cause areas where the MC is greatly below the data to not quite raise enough, as one cannot increase the MC, only decrease other areas (i.e. the number of pi0s at other vertex Z positions) so that the relative amount increases.
Samples
The data uses a mockup L2 cut of 2 and 4 GeV. The MC samples to consider are
- "f0", with threshods set to the actual L2 thresholds, 3.7 and 5.2
- "f24b", which uses 1/0.97 the data thresholds, i.e. 2.06 and 4.12 GeV. This is the "worse data/MC comparison" set.
- "f24b-VZW" the (V)ertex (Z) (W)eighted (actually accpetance/rejection) method described above applied to the "f24b"
Results
Vertex Z distribution in lowest pT Bin (4-5 GeV)
Attached at the bottom of this blog are pdf files with the comparison of the kinematic variables (data vs. MC) for the "f24b-VZW" set. Simular plots for the other sets are here. To highlight that the acc/rej worked, here are the vertex Z plots for each of the three cases. The order of plots are "f0", "f24b", and "f24b-VZW", and this order will be followed for all the plots below.
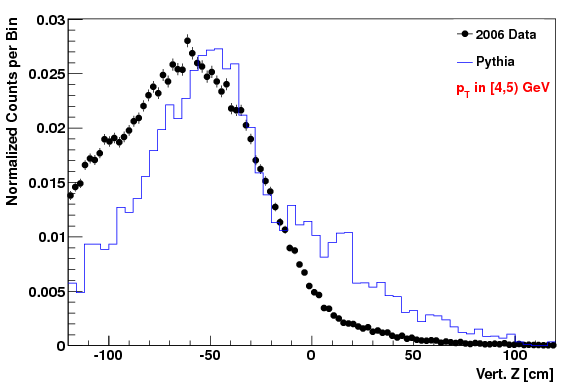
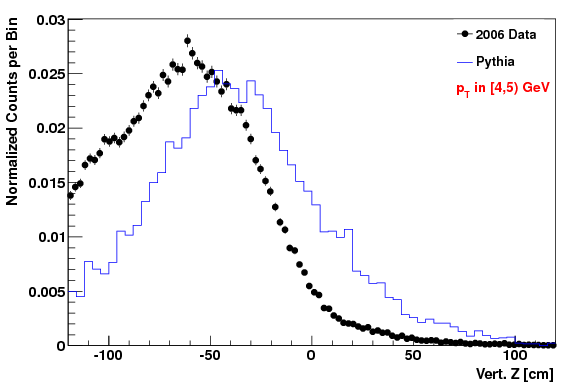
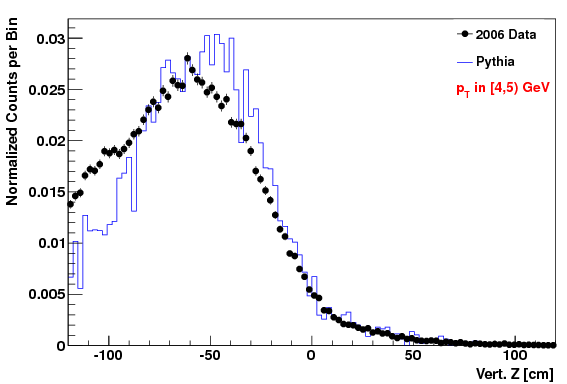
The fact that the lowest Z values didn't get quite raised enough in the MC is due to the choice of max weight not being quite high enough (but we didn't want to set it higher or we'd loose too many statistics in other (Z, pT) regions).
The entire analysis procedure (background subtraction, unfolding, etc.) is repeated using each of the above MC samples. The key indicators for whether this Monte Carlo sample is "better" or produces "different" results are: 1) the chi^2/ndf values from the fit, and 2) how much the unfolded number of counts change. The change in the final cross section is not a good measure, as we have artificially reduced the number of pi0s in the MC (including in Z-vertex regions where the data/MC agreement was OK) in order to heighten the relative number of pi0s in areas where the Monte Carlo was deficient in the number of pi0s, i.e. we can no longer use this sample to estimate the reconstruction efficiency.
Chi^2/NDF
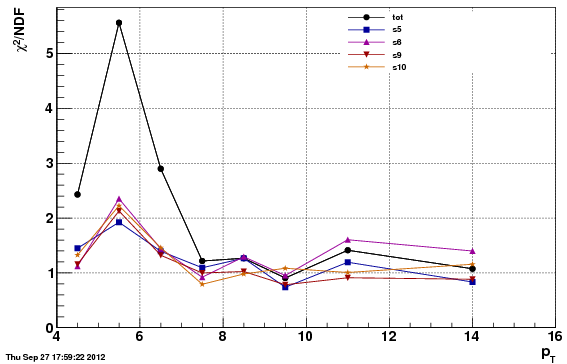
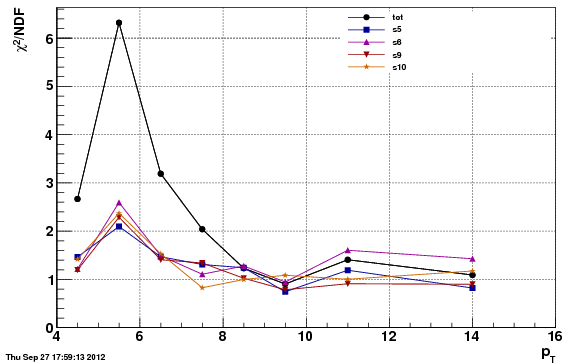
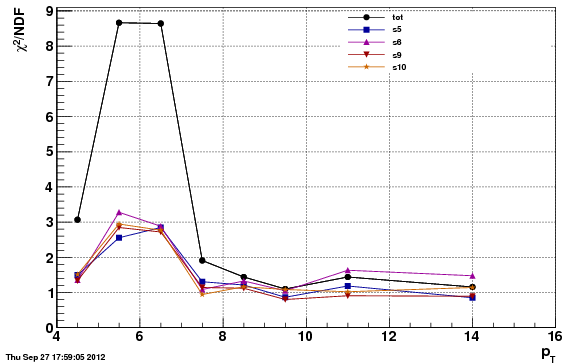
Note: the chi^2 is worse for the second option (f24b) than the first (f0), which is expected since the data/MC comparison is worse. However, the acc/rej method to get the vertex Z to match, applied to f24b, further
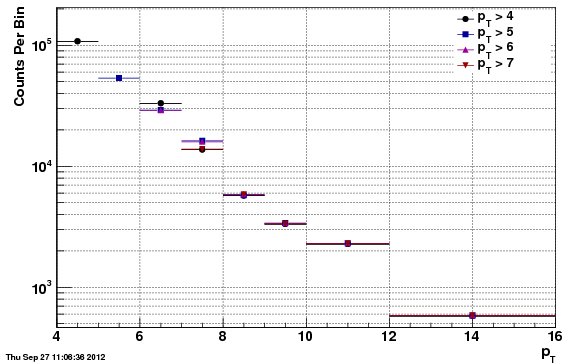
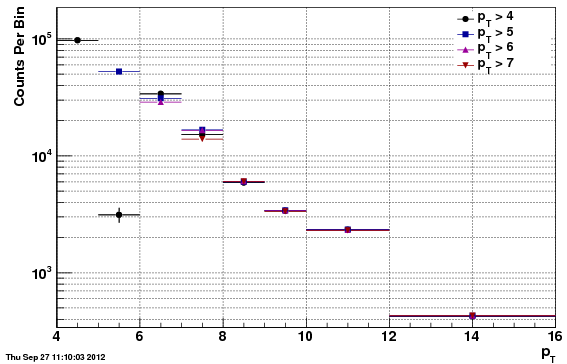
Unfolded Values
Tables (in attached spreadsheet)
Attached is a spreadsheet with several comparisons.
1) f0 vs f24b Cross Section Comparison
This is the comparison of the final cross section values for f0 vs. f24b, which has the calculation showing the an additional systematic of half the differernce in the result for f0 vs. f24b is negligible compared with the other systematics--at most a 2% increase.
2 & 3) f0 vs f24b and f0 vs f24b-VZW Unfold Count comparison
As noted above, one cannot compute the final cross section fully using f24b-VZW, due to the reconstruction efficiency being effected in unphysical ways by the acceptance/rejection procedure. Instead, the unfolded counts are compared, first the f0 vs f24b for comparison, and second the f0 vs f24b-VZW. Only the statistical uncertainties are included, and so the apparent chi^2 is quite poor for both. However, the t-test values show that the comparison is reasonable (t-tests are much less than one) and that the f24b-VZW is actually more different than f0 than is f24b (although the vertex distribution is less different).
4) f0 vs estimate of f24b-VZW Cross Section
The efficiencies and other values used to compute the cross section from the unfolded counts are taken from the f24b data, but then applied to the f24b-VZW unfolded counts. As with (1), the systematic related to 1/2 the difference is computed, and again the maximal change in the systematic by adding this new systematic is a 2% increase.
Conclusions
Adjusting the vertex Z in this manner actually degrades the chi^2 values over our nominal choice of "f0". This likely due to the fact that the difference in the Z-vertex is correlated with other things (such as the trigger and eta). The above approach assumes a 1D fix is enough, which appears to be untrue.
Even so, this provides another estimate of the uncertainty due to the lack of agreement in data and Monte Carlo. This estimate is consistent with the first estimate, that such a systematic would increase the overall systematic by at most 2%, and is thus negligable.
- sgliske's blog
- Login or register to post comments