EEMC Energy Scale
Details about whether the 2% value is still appropriate for the EEMC energy scale uncertainty.
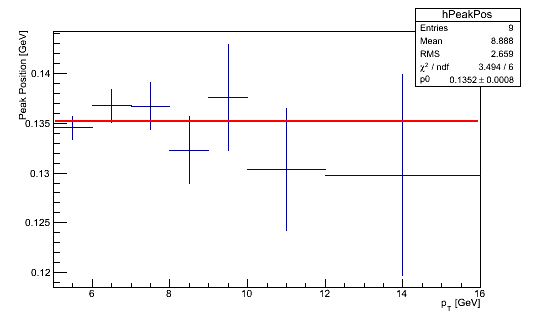
Here is the updated peak position. I didn't focus on cosmetics, but I did add a fit to a constant.

The chi^2/ndf is 3.5/6, suggesting the amount of variation is much less than that expected by the error bars. Details below about how the error bars are computed. However, the uncertainty on the resulting fit value is 0.0008, or a relative uncertainty of 0.6%---very small. The ratio of the fit value over the PDG value is 0.1352/0.1350 = 0.15%. This is much lower than the currently used value of 2% EEMC energy scale, which corresponds to 2.7 MeV. We can take the central values and make a histogram, resulting in

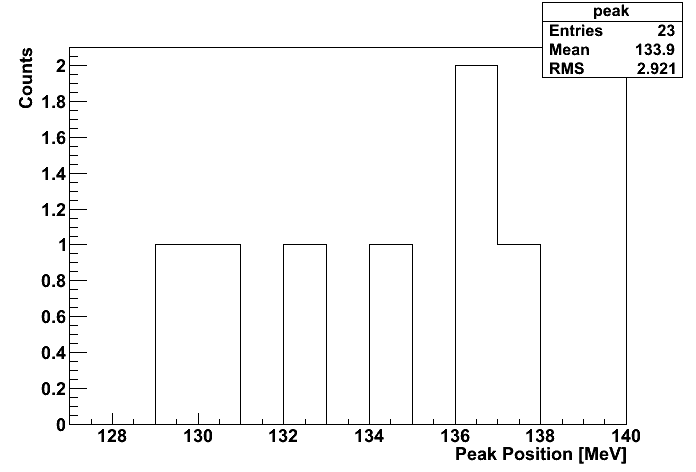
The results from histograming the central values is effectively the same as fitting and ignoring the error bars. The mean is 133.9 MeV, 1.1 MeV from the PDG value, or 0.8%. The RMS of the points is 2.921 MeV, corresponding to a relative uncertainty of 2.16%. Perhaps the corseness of 1 MeV bins is effecting this estimate, so I directly computed the mean and standard deviation of the 7 points. The result is 134.00 +/- 2.9742. The sigma/134.9766 is then 2.20%.

While plot does show a larger shift from the PDG value, the shift is still only 1.4 MeV or about 1%. The uncertainty on the fit is 1.1 MeV, again about 1%. One could possibly could add these two in quadrature, and also add in another 1% for the sensitivity to cuts (since the new is a little different than the old), so sqrt(3)% is about 2%.
How the peak position is computed
It is wise to recall that the peak position does not directly come out of the standard fitting procedure. To determine the peak position, we scale the MPV of the signal template by alpha. We assume the uncertainty on the MPV is equal to the uncertainty on the mean. To get the uncertainty on the mean, we refit the histogram (which the template function was originally fit to) in the region 0.1 to 0.2 to a Gaussian. We use the uncertainty on this mean as the uncertainty on the MPV, and then propagate the uncertainty on alpha and the MPV to get the uncertainty on the peak position. The uncertainty is dominated by the uncertainty on alpha.Updated Peak Position
Here is the updated peak position. I didn't focus on cosmetics, but I did add a fit to a constant.

The chi^2/ndf is 3.5/6, suggesting the amount of variation is much less than that expected by the error bars. Details below about how the error bars are computed. However, the uncertainty on the resulting fit value is 0.0008, or a relative uncertainty of 0.6%---very small. The ratio of the fit value over the PDG value is 0.1352/0.1350 = 0.15%. This is much lower than the currently used value of 2% EEMC energy scale, which corresponds to 2.7 MeV. We can take the central values and make a histogram, resulting in

The results from histograming the central values is effectively the same as fitting and ignoring the error bars. The mean is 133.9 MeV, 1.1 MeV from the PDG value, or 0.8%. The RMS of the points is 2.921 MeV, corresponding to a relative uncertainty of 2.16%. Perhaps the corseness of 1 MeV bins is effecting this estimate, so I directly computed the mean and standard deviation of the 7 points. The result is 134.00 +/- 2.9742. The sigma/134.9766 is then 2.20%.
Conclusions
There is no indication that the choice of 2% is far away from the best value. One could possibly consider 2.1 or 2.2%, but there is no reason to expect any higher than this. In fact, the uncertainty on the peak positions are important, and in this case, 0.6% is the suggested value. Based on these studies the chosen value should be betweeen 0.6% and 2.2%. I would actualy prefer a value around 1%. Knowing others in the spin group are uncomfortable with such small numbers, I am willing to go with a value as large as 2.2%.Update
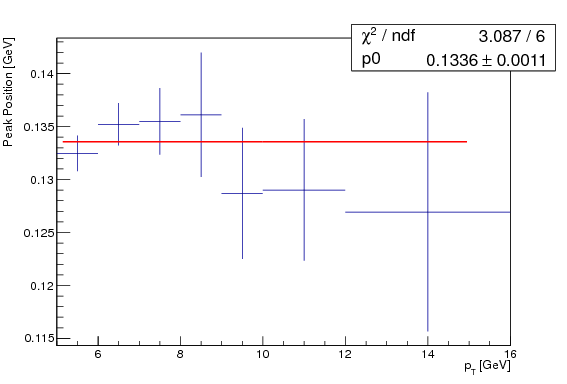
Here is the older plot that Will had been looking at, fit to a constant:
While plot does show a larger shift from the PDG value, the shift is still only 1.4 MeV or about 1%. The uncertainty on the fit is 1.1 MeV, again about 1%. One could possibly could add these two in quadrature, and also add in another 1% for the sensitivity to cuts (since the new is a little different than the old), so sqrt(3)% is about 2%.
Groups:
- sgliske's blog
- Login or register to post comments
