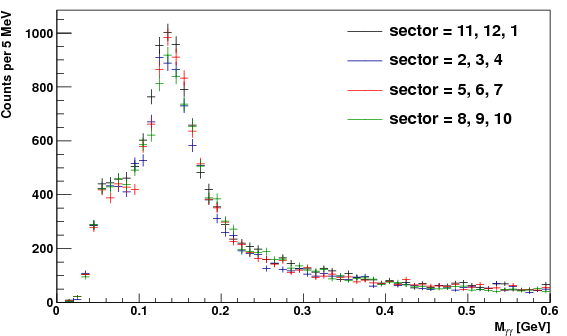
Mass Spectrum vs. Eta and Quarter.
As one attempt to look at the effect of single beam backgrounds, the diphoton mass spectrum for the entire data set is plotted in eta bins and per each quarter of the EEMC. The (physical) eta bins are defined as
0.8 1.25 1.4 1.55 2.0
The quarters are defined by sectors, with quarters
11, 12, 1
2, 3, 4
5, 6, 7
8, 9, 10
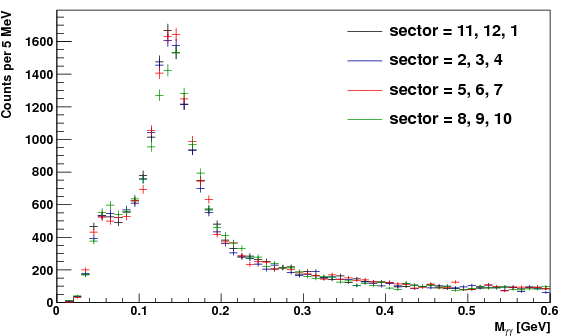
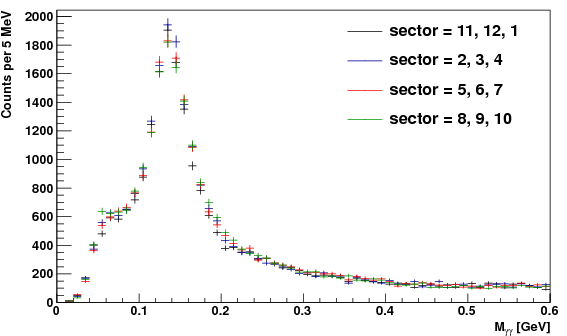
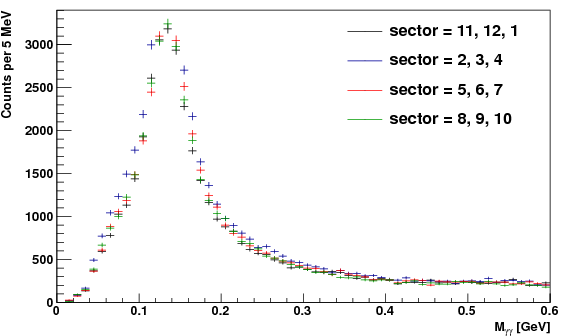
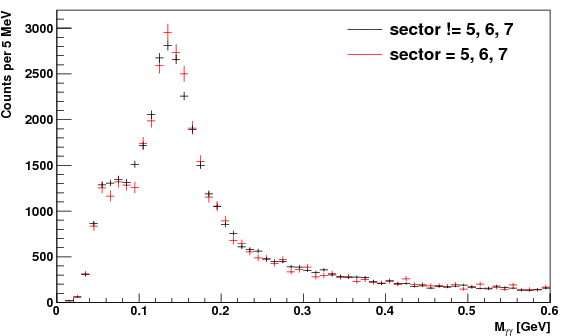
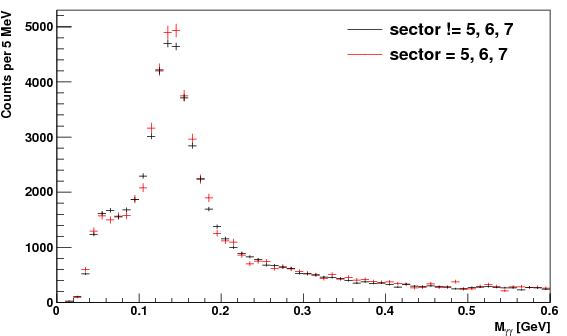
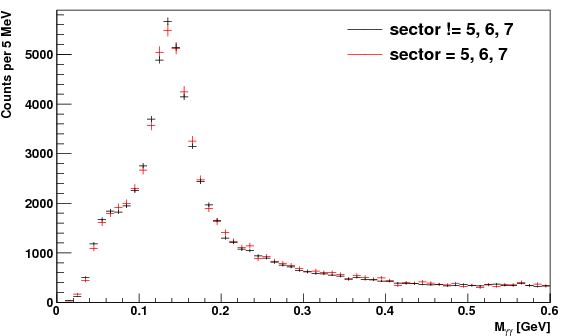
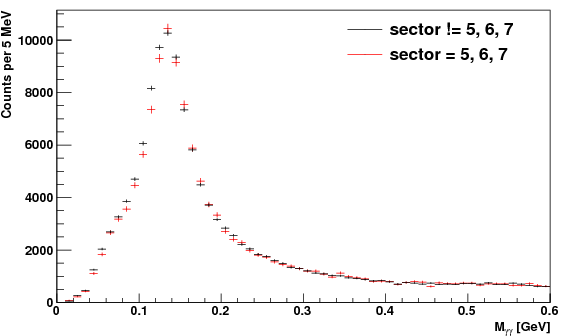
It is expected that single beam backgrounds coming from far enough upstream can be sheilded by the floor (since the floor in the hall is much lower than the floor in the beam line) and thus data from sectors 5,6,7 should have less "background", particularly in the low mass peak. Recall sector 6 is directoy below the beam line. The plots are listed in increasing eta bin, starting with bin 0.8 < eta < 2.0.
To further look at the difference between sectors 5-7, the distribution from sectors 5-7 is multiplied by three can compared with the sum of the other three sectors.
Conclusions
No obvious significant difference is observed. The only effect to note is that sectors 2-4 seem to have slighly mass resolution, as compared with the other quarters, in the highest eta region.Groups:
- sgliske's blog
- Login or register to post comments