Bjorken x for EEMC pi0s
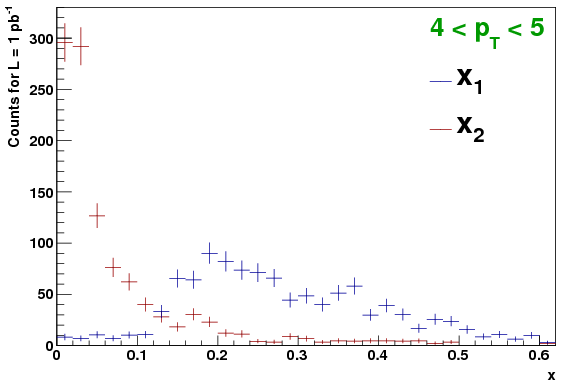
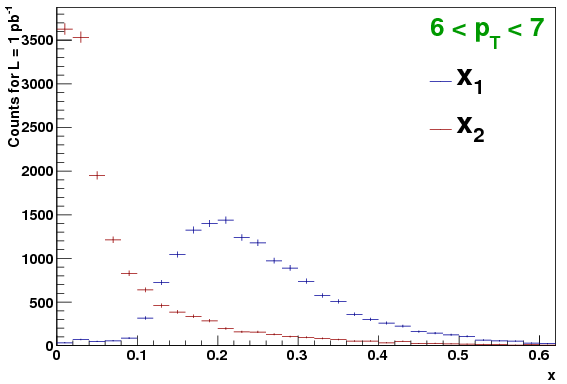
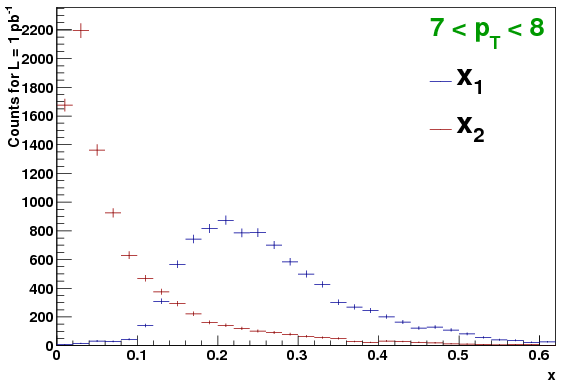
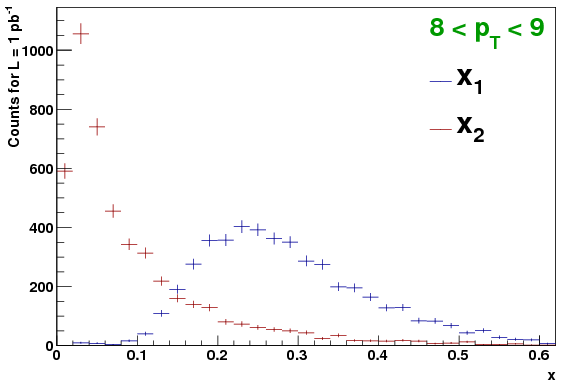
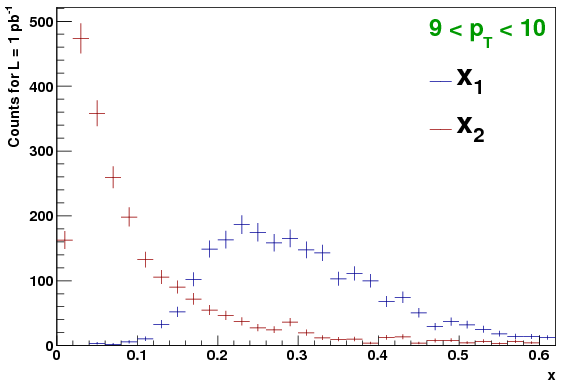
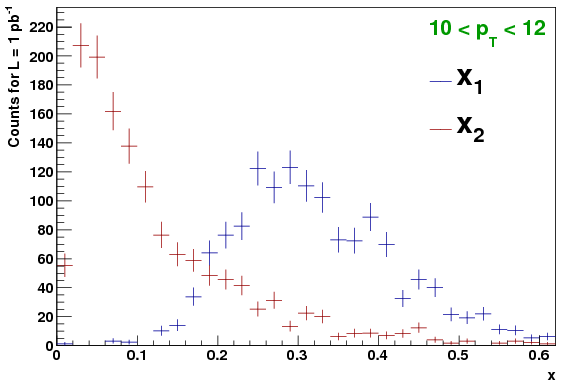
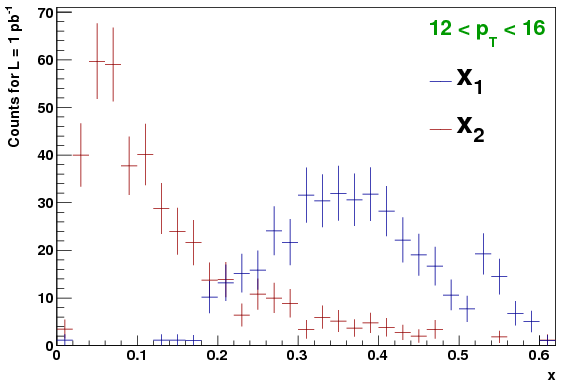
Here are plots of x1 and x2 from Pythia for reconstructed pi0s (i.e. signal) with reconstructed mass in 0.1 to 0.2 GeV. First plots are shown per pT bin, and then at the end various summary plots are given.

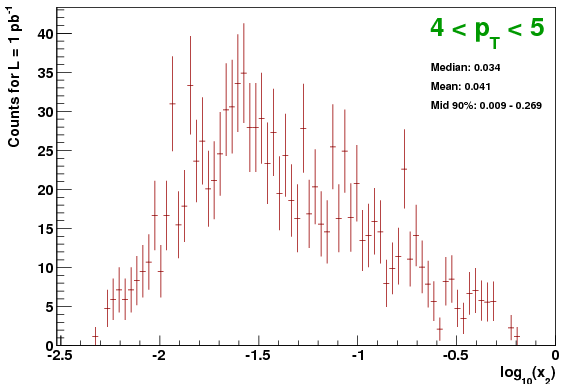
These plots give a better indication of the lower x2 limits. The "middle 90%" range is the range from the 5% and 95% percentiles.
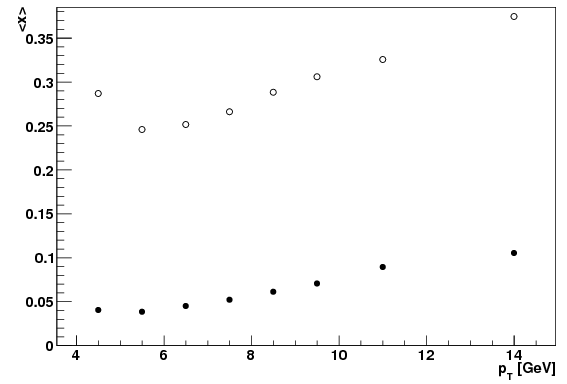
The next plot shows the mean x1 and x2 per pT bin. Well, actually it is 10^( mean (log_10(x2)) ). Such a plot could have the aspect ratio adjusted and be included as a lower panel (or split into two lower panesl) in the A_LL plot for the paper.
Results Per pT Bin, x1 and x2
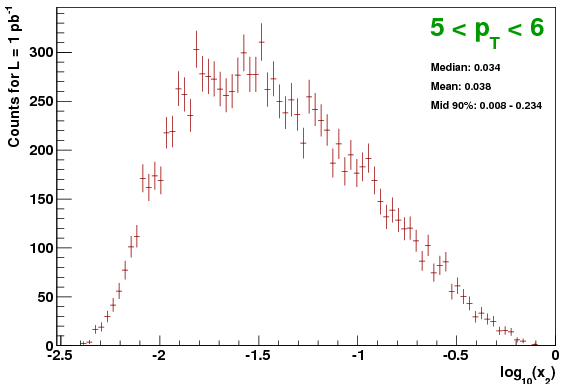
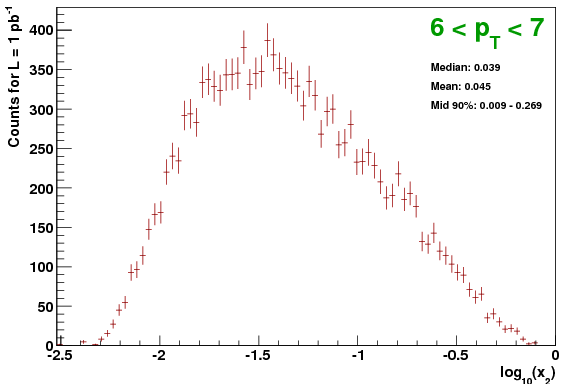
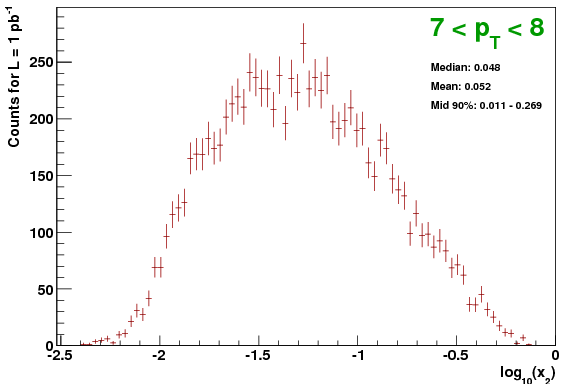
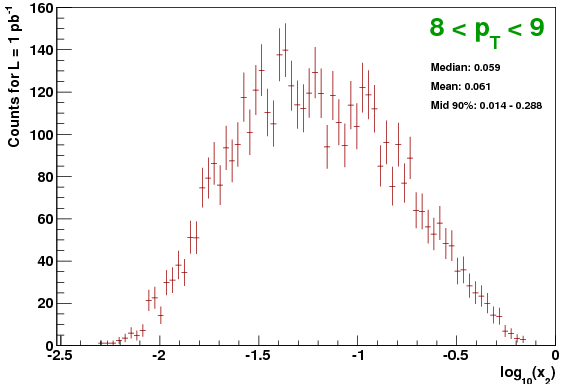
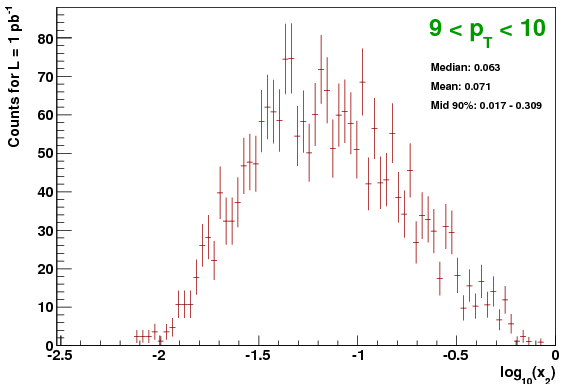
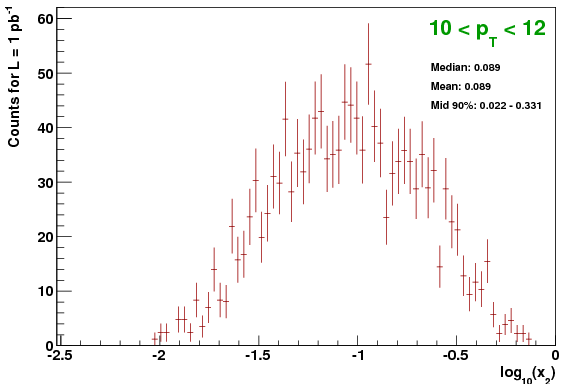
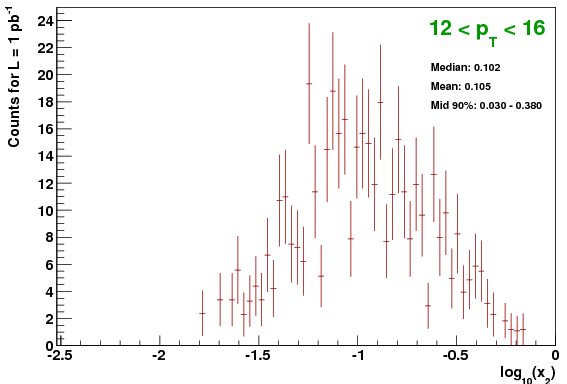
Results of log_10(x2) per pT bin
These plots give a better indication of the lower x2 limits. The "middle 90%" range is the range from the 5% and 95% percentiles.
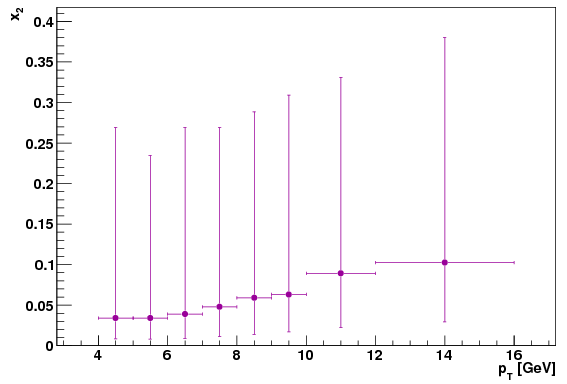
Summary Plots
This plot shows the median x2 per pTbin, with error bars extending from the 5th percentile to the 95th percentile.The next plot shows the mean x1 and x2 per pT bin. Well, actually it is 10^( mean (log_10(x2)) ). Such a plot could have the aspect ratio adjusted and be included as a lower panel (or split into two lower panesl) in the A_LL plot for the paper.
Conclusions
While mean, median, and MPV of the x2 distribution varies with pT, the 5th and 95th percentile positions do not vary so much. Thus the overall coverage doesn't change that much with pT, but the main x2 value being sampled does. It has been previously suggested to include a plot like the last one above as a subpanel of the A_LL plot for the paper. 10^( mean (log_10(x2)) ) is a funny thing to describe in a paper, so maybe we should plot the MPV instead, which numerically is very similar to what is plotted.Groups:
- sgliske's blog
- Login or register to post comments