EEMC 2006 pi0 systematics
Review of the systematic uncertainties for the cross section and longitudinal spin asymmetries.
Note: the background asymmetry has been updated. See this blog. Recall:

Systematics (1) and (2) are then propagated from uncertainties on and systematic (3) is the propagation of the uncertainty on
  . The statistical uncertainty is the progated uncertainty from
  .
.


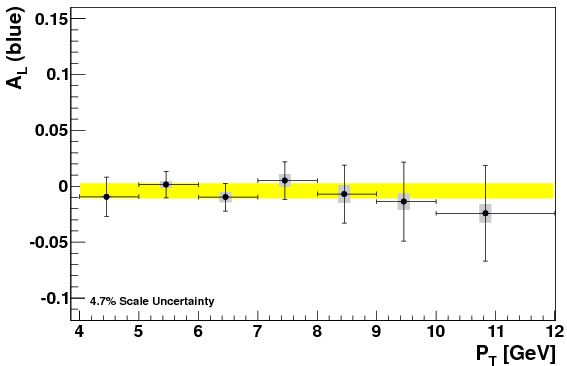
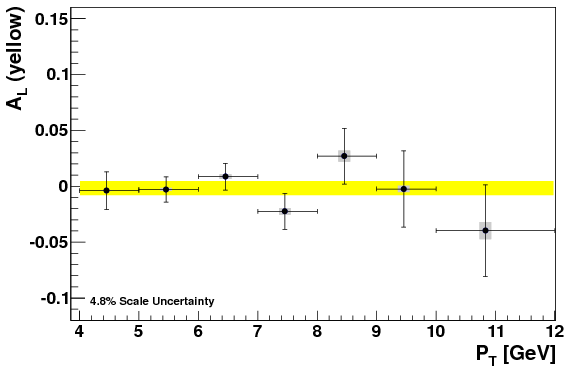
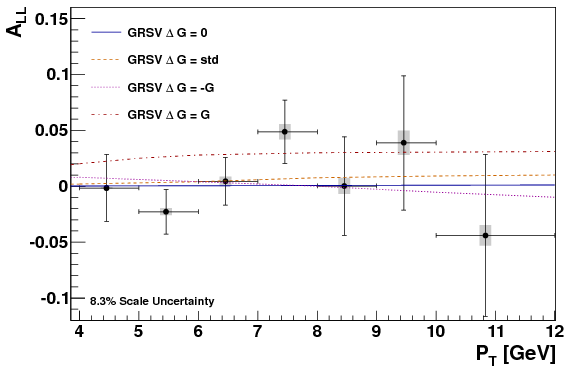
Note: for some reason the stat box disappeared at the last moment for the A_L plots. The current plan is to not explicitly put the plots in the paper, but just reference that they are consistant with zero. The values are (for A_L blue, A_L yellow and A_LL, respectively)
The energy scale uncertainty is the dominant systematic. It is based on a 3% overall uncertainty and computed by locally fitting the cross section to an exponential and integrating +/- 3% of the upper bin edge for each pT bin. At the lowest pT bin, the effect of whether to include (or not) an additional lower pT bin when unfolding also has a sizeable contribution.
.png)

Spin Asymmetries
The sizable systematic uncertainties included in the final results include:- The "propagated" uncertainty on the signal fraction, which includes contributions from
- The uncertainties and covariances of all the fit parameters in the template functions
- The uncertainties and covariances of the fitted weights of the template functions
- The uncertainty on the scale factor alpha, through its effect on the integrals used to determine the signal fraction in the peak region
- The effect of the uncertainty on the template functions (i.e. the uncertainties and covariences of the fit parameters) on the above mentioned integrals.
- The uncertainty on the signal fraction due to fitting the residual--equal to the effective number in the residual within the peak region (determined by fitting the residual) divided by the raw number of counts in the peak region
- The propagation of the uncertainty on the estimate of the background asymmetry.
Note: the background asymmetry has been updated. See this blog. Recall:
Systematics (1) and (2) are then propagated from uncertainties on
| pT bin | A_LL | Stat. | Tot. Sys. | Prop. | Res. Fit. | Bkg. |
|---|---|---|---|---|---|---|
| 2 | -0.002 | 0.030 | 0.001 | 0.000 | 0.000 | 0.001 |
| 3 | -0.023 | 0.020 | 0.003 | 0.001 | 0.001 | 0.003 |
| 4 | 0.004 | 0.021 | 0.004 | 0.001 | 0.000 | 0.004 |
| 5 | 0.049 | 0.028 | 0.007 | 0.004 | 0.001 | 0.005 |
| 6 | 0.000 | 0.044 | 0.007 | 0.001 | 0.000 | 0.007 |
| 7 | 0.039 | 0.060 | 0.011 | 0.009 | 0.001 | 0.006 |
| 8 | -0.044 | 0.072 | 0.009 | 0.007 | 0.000 | 0.006 |
Single Spin Plots


Money Plot

Note: for some reason the stat box disappeared at the last moment for the A_L plots. The current plan is to not explicitly put the plots in the paper, but just reference that they are consistant with zero. The values are (for A_L blue, A_L yellow and A_LL, respectively)
Fit result: -0.00431399 +/- 0.00682035 chi^2/ndf = 1.04425/6
Fit result: -0.00184262 +/- 0.00636425 chi^2/ndf = 4.43245/6
Fit result: 0.00125572 +/- 0.0112847 chi^2/ndf = 4.85498/6
Note: the A_LL (non-parity violating) is even more consistant with zero than the parity violating single spin asymmetries.
Cross Section Systematics
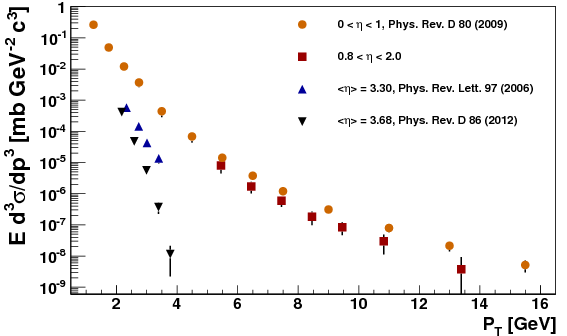
Systematic uncertainties on the cross section currently include:- Propagation of signal fraction uncertainty--equivelant to (1) for A_LL/A_N
- Propagation of residual fit--equivelant to (1) for A_LL/A_N
- Uncertainty on smearing matrix due to MC statistics
- Uncertainty based on whether to include the 4-5 GeV bin when unfolding
- Uncertainty on the reconstruction efficiency
- Uncertainty on the trigger efficiency
- Uncertainty on the EEMC energy resolution
- Uncertainty on the EEMC energy scale
| L.W. pT [GeV/c] | Stat. | Tot. Sys. | Prop. | Res. Fit. | Smearing Matrix | Unf. Range | Reco. Eff. | Trig. Eff. | Energy Res. | Energy Scale |
|---|---|---|---|---|---|---|---|---|---|---|
| 5.457 | 0.005 | 0.446 | 0.001 | 0.001 | 0.021 | 0.295 | 0.010 | 0.039 | 0.052 | 0.328 |
| 6.457 | 0.007 | 0.406 | 0.002 | 0.002 | 0.029 | 0.048 | 0.010 | 0.056 | 0.049 | 0.395 |
| 7.457 | 0.009 | 0.373 | 0.003 | 0.002 | 0.036 | 0.035 | 0.013 | 0.080 | 0.045 | 0.358 |
| 8.457 | 0.016 | 0.464 | 0.007 | 0.003 | 0.061 | 0.010 | 0.019 | 0.119 | 0.043 | 0.442 |
| 9.457 | 0.023 | 0.446 | 0.012 | 0.003 | 0.090 | 0.003 | 0.028 | 0.162 | 0.040 | 0.401 |
| 10.831 | 0.022 | 0.627 | 0.011 | 0.003 | 0.095 | 0.001 | 0.036 | 0.152 | 0.038 | 0.598 |
| 13.382 | 0.037 | 1.488 | 0.022 | 0.010 | 0.217 | 0.003 | 0.066 | 0.231 | 0.034 | 1.451 |
The energy scale uncertainty is the dominant systematic. It is based on a 3% overall uncertainty and computed by locally fitting the cross section to an exponential and integrating +/- 3% of the upper bin edge for each pT bin. At the lowest pT bin, the effect of whether to include (or not) an additional lower pT bin when unfolding also has a sizeable contribution.
Money Plots
.png)

Groups:
- sgliske's blog
- Login or register to post comments
