19.6 GeV Calibration: Final Look at the Numbers
I have completed some histograms which show the "drift" of ADC values for the 1st MIP peak from fitting the daily ADC spectra for each tile. The histograms take the absolute deviation, per day per tile, from the average for all days in the range. For instance, the file ADCDelta_60_71.pdf is plotted from day 60 to day 71 and shows the deviation from the average value (per tile) for days 60-71.
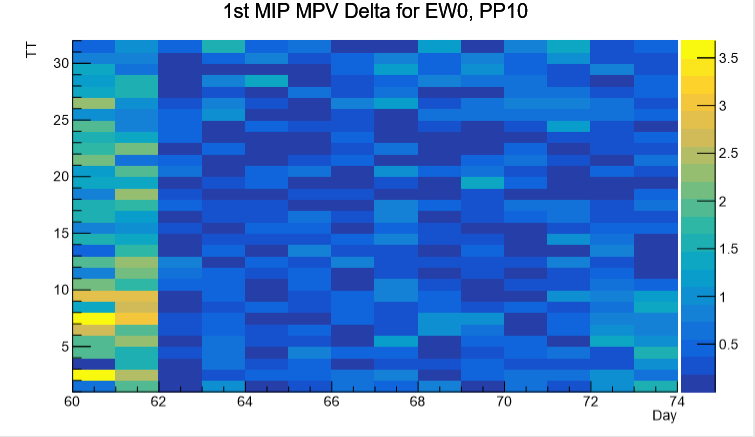
We can see that an average value for all days just won't work; file ADCDelta_57_93.pdf (which is the full run for 19.6 GeV) has some really large spreads. Here's a look at East PP10:
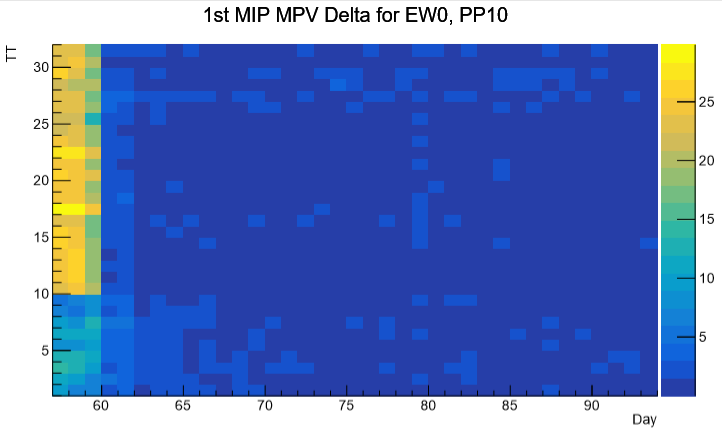
We can see that the QT32B boards have big issues with days 57-59. It's hard to know if the spread for other days and tiles are poor due to the dominance of the QT32B, 57-59 day deltas. It was already pretty clear that these would be problematic. See, for instance, this plot:
Days 57-59 don't even show up, so it's no wonder we have the issue with the overall deviation from average for 57-59, QT32B tiles. In the last EPD meeting, I had said that it appears we can split the fit days into the following ranges:
57, 58, 59 (all separate)
60-71
72-73
74-87
88-93
We can maybe do a little better than this with the new plots for ADCDelta. If we set a criteria that we can accept a deviation from average (absolute deviation, that is) of ~5 ADC, we can use the plots to narrow down the ranges. First, I'll say the above ranges fit rather well. If we went with those, it would be a good set of fits; but maybe they're too tight. After all, if a tile has a max absolute deviation of 2 ADC for days 60-71 but only of 3 ADC for days 60-93, there's no reason to break it up.
Aside from EW1PP8TT22 (a known offender for not fitting well; more on this one later), there are no days for any tile with a deviation above ~3.2 ADC for the day range 60-71. Here are the greatest spreads, aside from outliers, for the day ranges already broken out:
60-71: ~3.5 (outlier EW1PP8TT22: ~5)
72-73: ~1.4 (no outliers)
74-87: ~3.7 (outliers {EW1PP7TT5: 4.5, EW1PP8TT22: 10, EW1PP9TT12: 5.5})
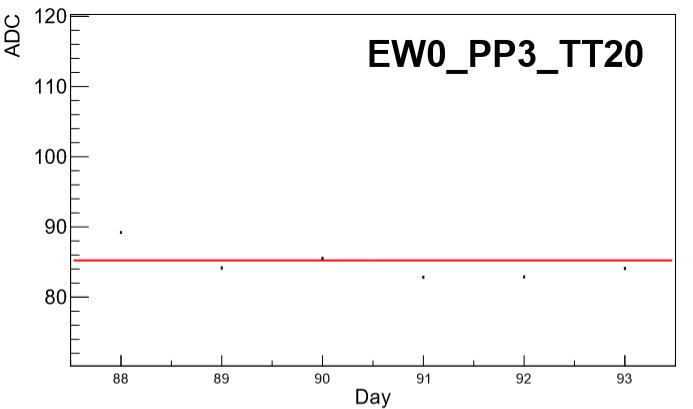
88-93: ~3.5 (outliers {EW0PP3TT20: 4, EW1PP8TT22: 7})
The vast majority of the tiles are nowhere near even the greatest spreads, never mind the outliers. Before going on, let's look at some of the outliers for the given ranges.
Outliers
Day Range 60-71
EW1PP8TT22:
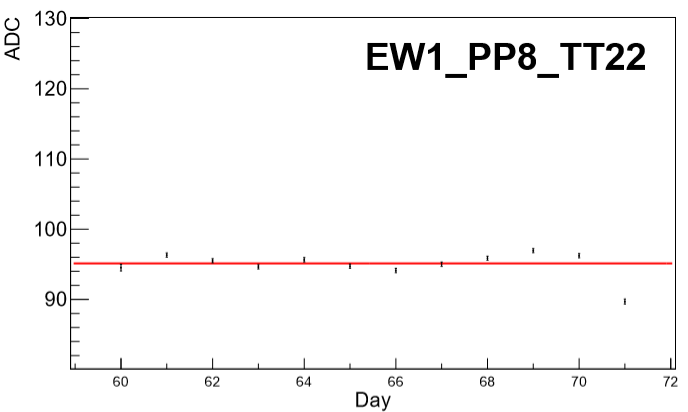
This wanders about a bit and then drops. I'll say that this tile is really all over the place and has been for every calibration, so I'm not too concerned with it (as far as calibration is concerned); see my presentation in the last blog. Trying to find a "good fit" for a day range for this tile is not going to be feasible.
Day Range 74-87
EW1PP7TT5:

This tile seems to wander all over, so no need to break out the days further.
EW1PP8TT22:
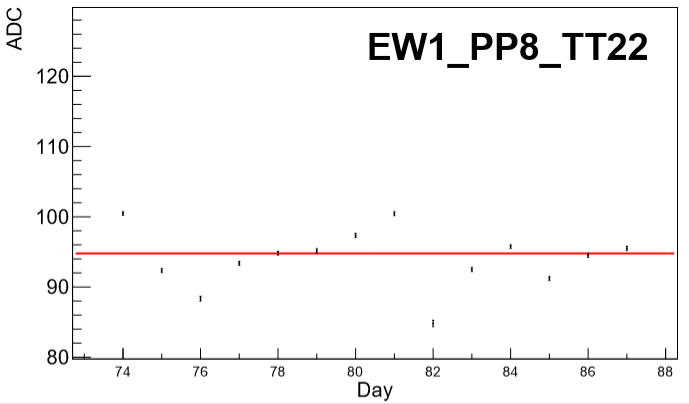
This is all over the place. Like I said, fitting to a day range seems a fool's errand.
EW1PP9TT12:
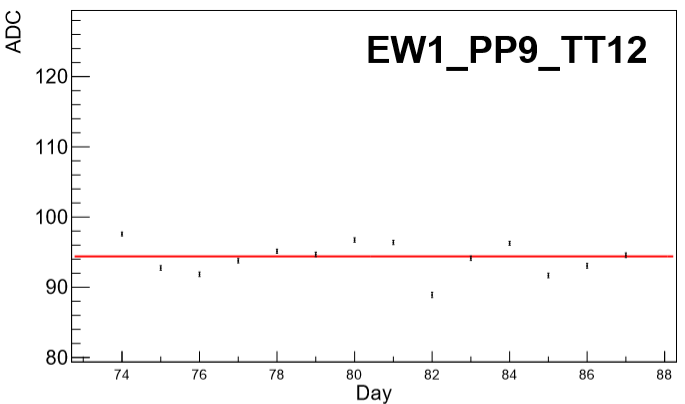
This one also seems to wander, so I think that an average value for all days seems fitting.
Day Range 88-93
Day 88 is the outlier, here. But even still, the spread isn't very high.
EW1PP8TT22:
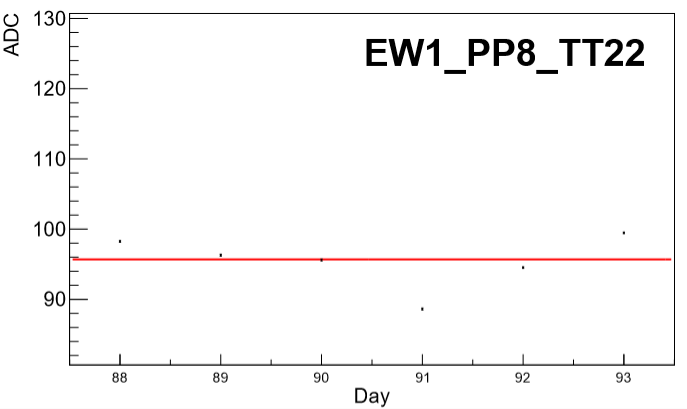
As usual for this tile, no real pattern emerges.
That's it for the outliers; I'm inclined to say that the day ranges specified above work well. Now to see if we can get another range to work as well. First, let's consider the range 60-73. The ADC deltas go up to ~5 for tiles apart from EW1PP8TT22 (which is ~5.5). There's also a difference between the deviation for east and west supersectors. Here are a few, emblematic plots:
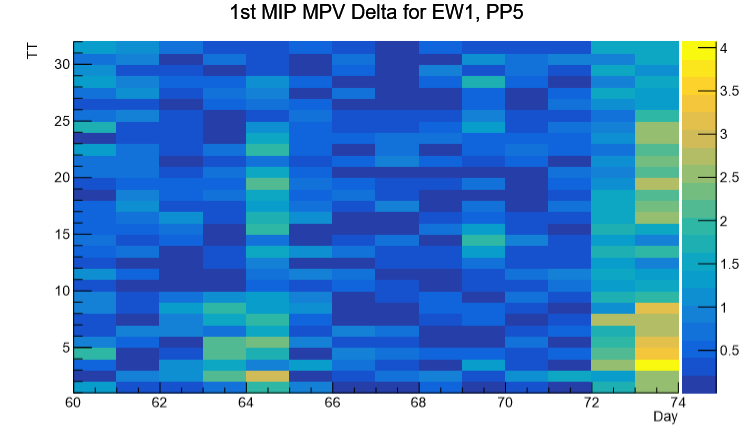
We can see that the first two days are problematic for the east supersector, but the last two for the west supersector. Let's drill down on a few tiles to see the trend close up.
EW0PP10TT7
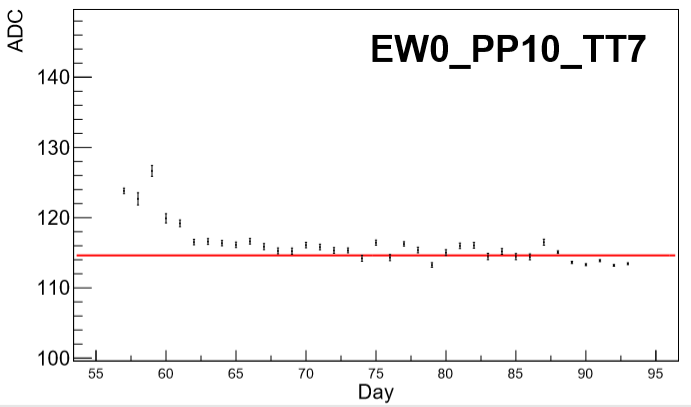
We can see that days 60-61 are a bit higher than the rest. We also see that days 88-93 are lower than the rest.
EW1PP5TT2:
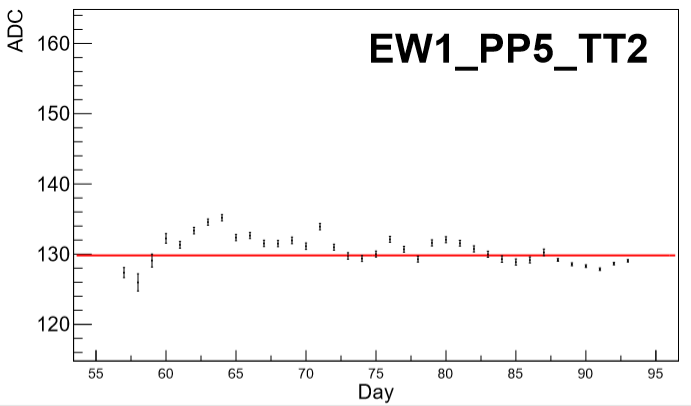
This tile has no such obvious trends, though the range of values for days >72 do seem overall lower.
I think leaving the split between days 71 and 72 still seems reasonable, so let's look at the split between days 74 and 75 and between days 87 and 88. Fitting the whole range from 72-93, most of our ranges fall below 4 ADC. We have a couple of outliers: {EW0PP3TT20: ~5, EW1PP4TT12: ~4.5, EW1PP7TT5: ~4.5, EW1PP8TT22: ~11, EW1PP9TT12: ~6}. Some of these are only outliers for a single day's deviance, like for EW1PP9TT12:
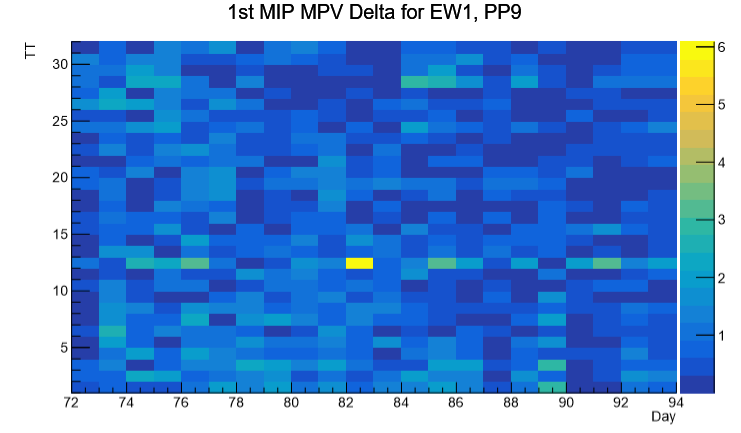
Aside from day 82, the deltas are quite small. I'm not going to go over EW1PP8TT22 as it's a known offender, but let's look at the delta plots for the others.
EW0PP3TT20:
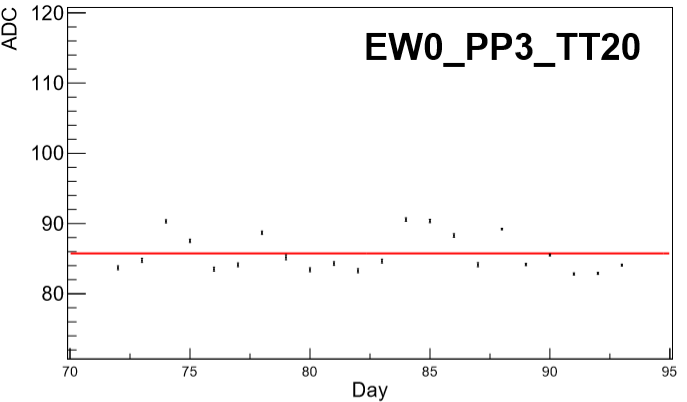
There doesn't seem to be a day range in here that would lend itself to a better fit, so I would be inclined to simply give an average over all days.
EW1PP4TT12:
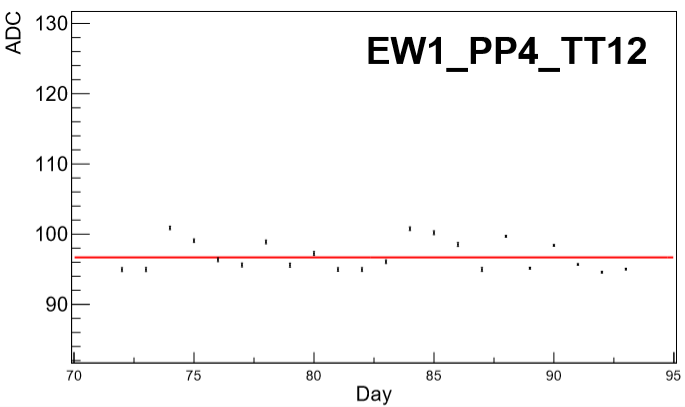
This tile as well doesn't seem to have a clean day range cut.
EW1PP7TT5:

As with the others, there doesn't seem to be a clear day cut that would help with the fits.
In light of this last analysis, I would amend the fit day ranges to the following:
57, 58, 59 separately
60-71
72-93
If this is acceptable, we should be ready to close the book on calibrations for the EPD for the 2019, 19.6 GeV run.
Files are attached for review as well as a text file of the macro used.
- skk317's blog
- Login or register to post comments