EPD Calibration Continued
EPD calibration continues. As of now, I still only have working data from days 110-122 (excluding 115, which has no data). For those days, the following tasks have been performed:
- Each tile for each day has had it's ADC vs counts plotted and fit with a multiple Landau curve
- Errant tiles with poorly fitted curves have been manually adjusted to have correct fits
- The height (with error) for the first peak maximum (which is also the local maximum for all but the dark current area of the graph) has been extracted
- These maxima have been plotted per tile for all days
- The slope of the line, d(MIP)/d(day), has been extracted (with error)
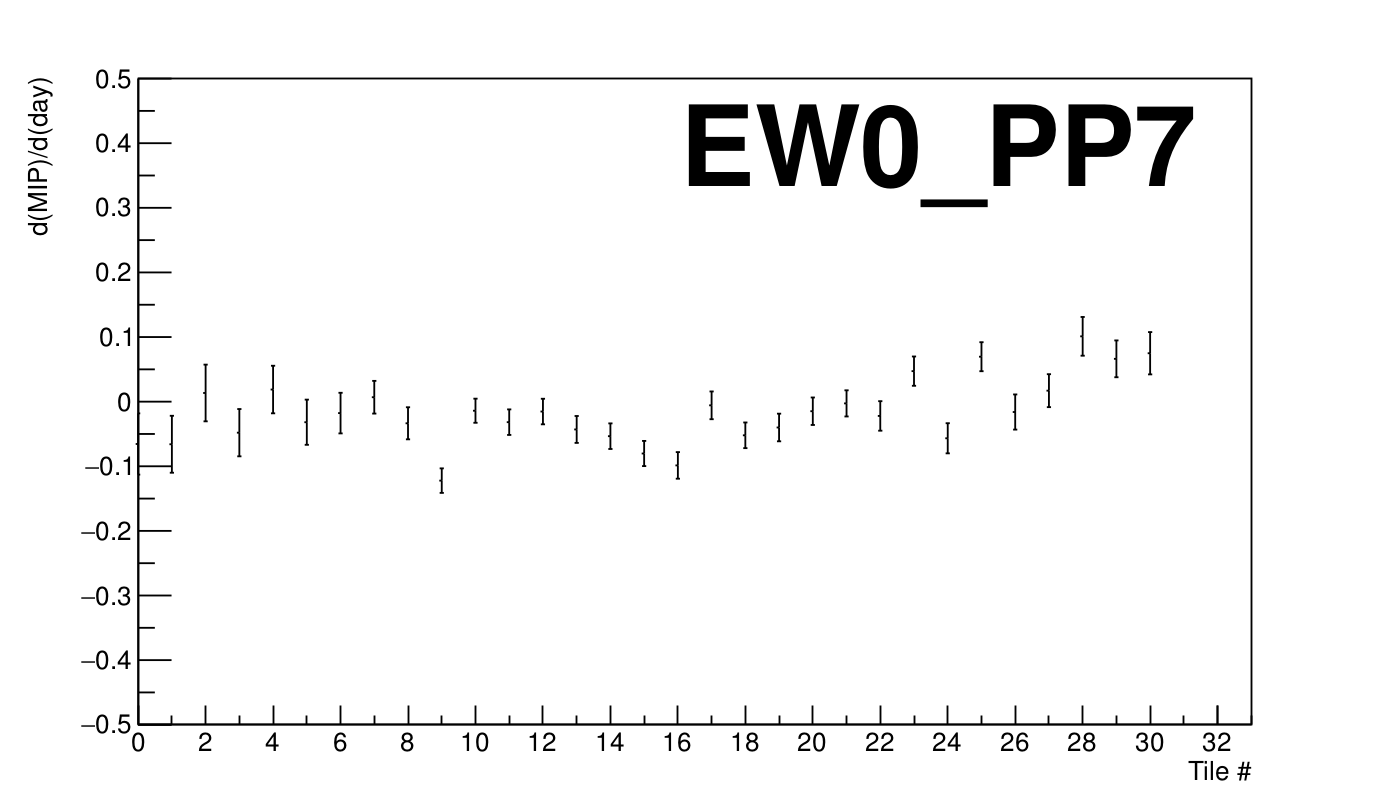
- All tiles have been plotted for their d(MIP)/d(day) and displayed by supersector
The following is an example of a graph for the first MIP peak for a tile:

All like graphs for each tile will have an ADC spread of 30 ADC, though tiles 1-9 will have a range from 135-165 and tiles 10-31 will have a range of 100-130. The idea is that, if a tile is having some sort of issues with the associated electronics, it will manifest in one of two major ways. One, it could be that a given day for a given tile has data that seems out of line with other days for that tile. Two, it could be that a given tile has some sort of issue such as increasing ADC over the course of the runs. In the first case, visual inspection graphs such as the one above is a good first step towards identifying an anomaly. In the second case, we can take the slope for the line fit for each tile and plot them next to each other to see if any tile has a trend away from an average, first peak, ADC value.
For this second case, we can plot the line fit slope (d[MIP]/d[day]) vs the tile number and directly compare tiles to one another. I have created graphs based on supersector as graphing all 744 tiles together is a bit cumbersome and does not really help the identification of errant tiles (to aid in comparison, I have made the slope value range the same on all graphs). Here is an example:
The next step will be to gather the rest of the days' data and include it in the above processing. I have included pdf files for both of the above graphs (with all of the tiles included), but this is again solely for days 110-122 (115 exclusive). We now have the data for the other days (this is all for the Isobar, 200 GeV runs), but we're having an issue running it through the code as either something in the structure of PicoDstReader has changed, something in the data structure has changed, or we have pulled data incorrectly. That issue will hopefully be resolved in short order and we can then process the entire, Isobar run for EPD calibration purposes.
- skk317's blog
- Login or register to post comments