EPD Calibration: Isobar, Chi^2
I have now completed going over the Isobar data for EPD calibration purposes (PicoDST data set, non-minbiased). I have plotted the average nMIP peak position (in ADC) per tile per day, fit that graph to a p0 polynomial (average value, essentially), then plotted the Chi^2/Ndf for each tile by supersector. Below are the preliminary results.
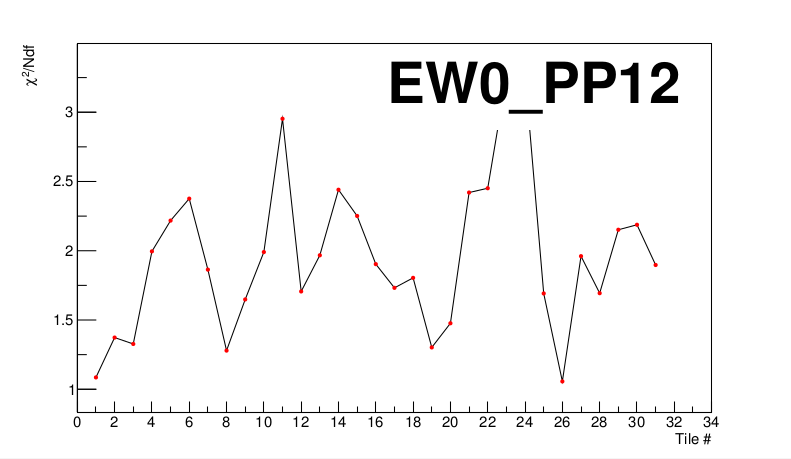
First, some of the data fit very nicely. For instance, here is the Chi^2/Ndf plot for East supersector 12:
I have the following supersectors which all have fits of Chi^2/Ndf ~<= 5 (listed as EW,PP):
0,3
0,4
0,5
0,7
0,9
0,10
0,12
1,5
1,6
1,10
There are others where we probably have a goof fit, but there may be a single value that's throwing our Chi^2/Ndg off. For instance, EW1PP2:
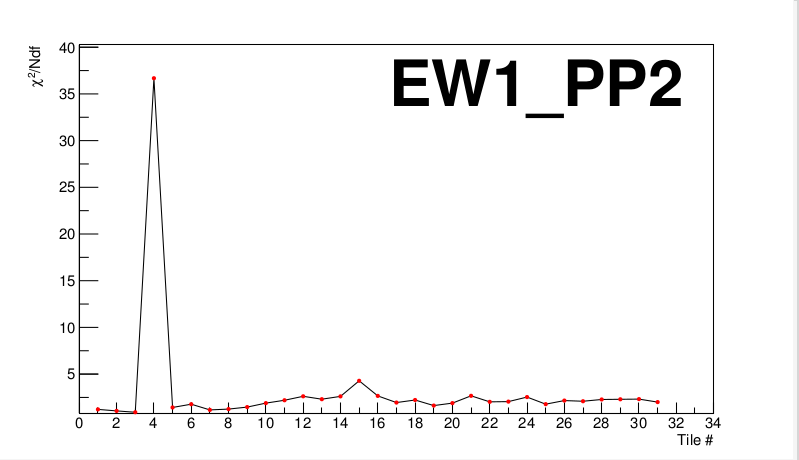
We can easily see that tile 4 is the misbehaving tile. Looking at the plot for tile 4 where we fit the p0 polynomial:
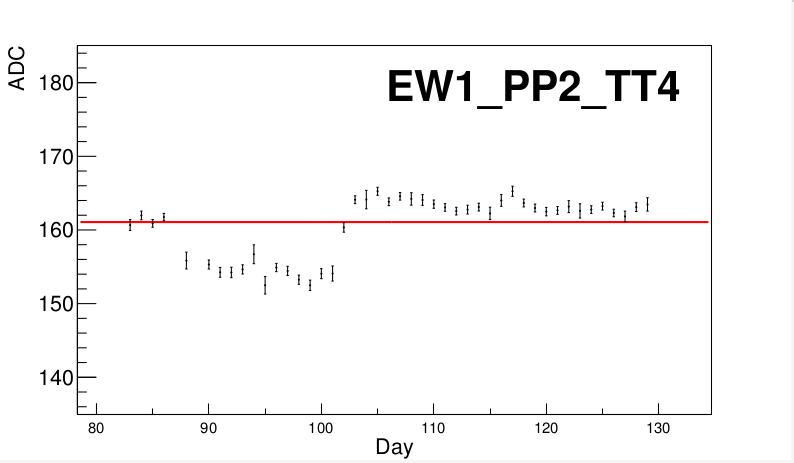
We see here that days 88-101 (note: days 87 and 89 are absent from our data set) appear to have a lower average value than the rest of the days. We could possibly fit days 88-101 separately and omit them from the first fit.
A similar issue is found with supersector West-3:
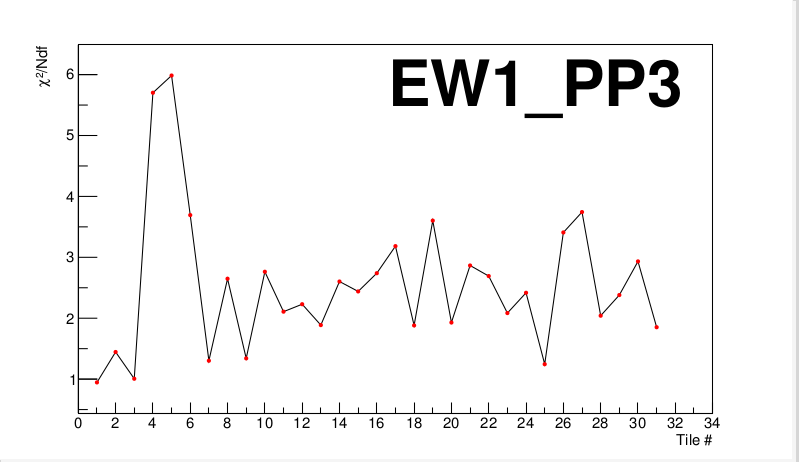
Tiles 4 and 5 appear to be much worse fitting than the rest. When investigating those tiles, we find:
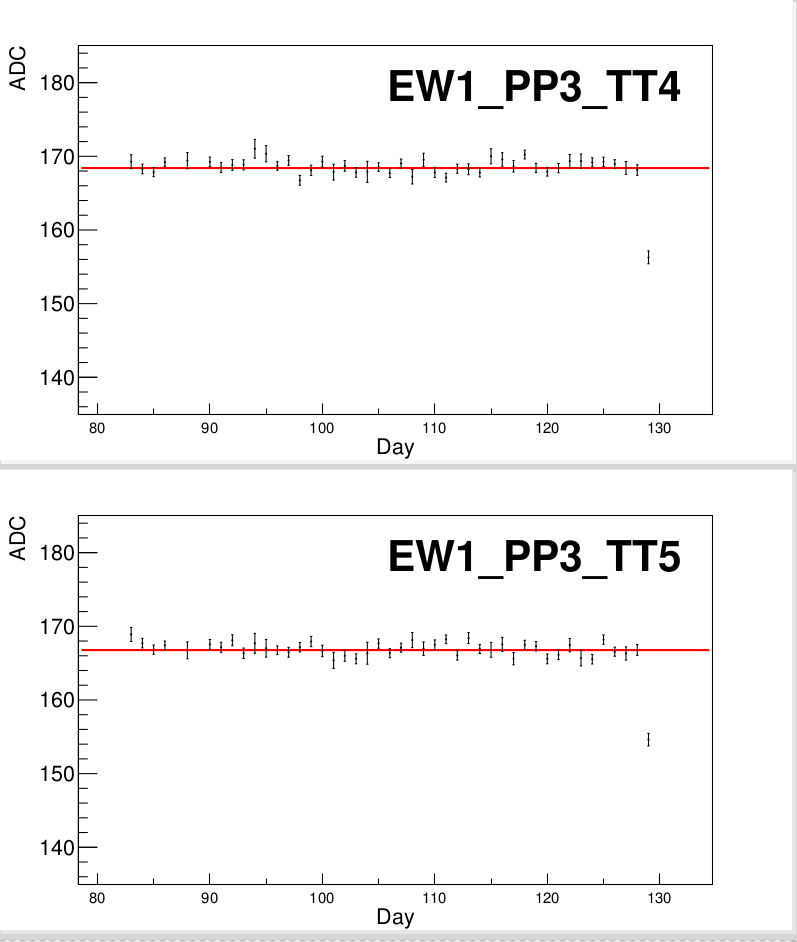
The last day for both looks like an outlier. I'm thinking of going back and examining the fit for this day/tile to see if it was maybe amiss and wasn't caught.
Then we have tiles that are just awful. For example, let's look at the worst offender: West-8.
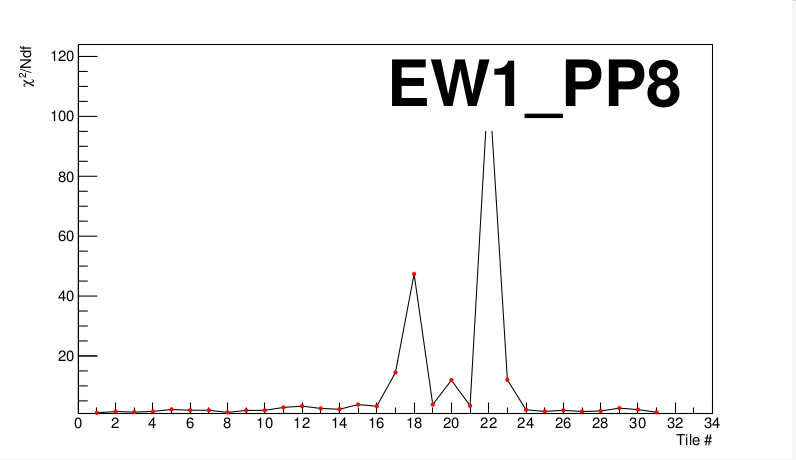
Tile 22 has a very poor fit to say the least. Let's take a look at it:
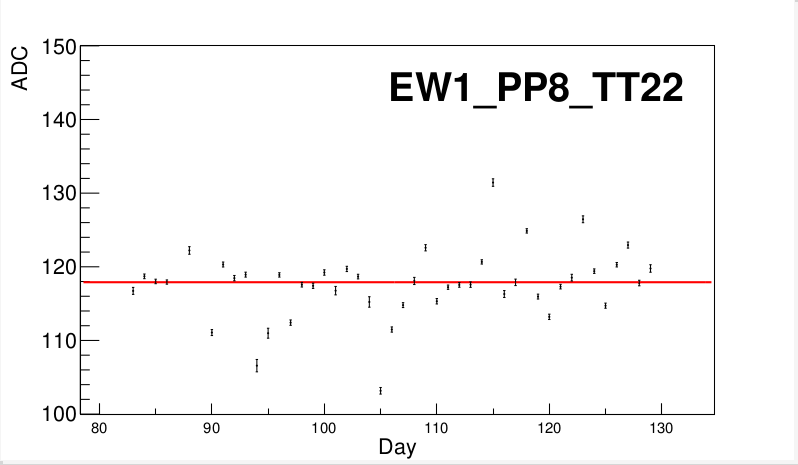
I don't see a clear trend, here; just a lot of fluctuation. For a tile this poorly behaved it might be more expeditious at this point to simply enter in a different nMIP value by day. Rosi Reed and Mike Lisa will be looking this over and giving some input as to how they'd like to move forward from here.
I have attached the pdf files for the images generated above.
- skk317's blog
- Login or register to post comments