EPD Calibration: Isobar Data, First Run
I now have the complete PicoDST data set for the Isobar run. The days I have are: {83-86, 88, 90-129}. I have completed fits for the nMIP peaks for each tile for each day and found their fit (ADC vs day per tile) to a p0 + p1x polynomial fit. I have then graphed the p1 coefficient for each tile and graphed them by supersector.
I plan on changing the parameters graphed to a p0 fit and then graphing X2 / (dof). For now, I'm using the graphs of the p1 values to look for any errant tiles that may need better fits. For example, here is a graph of a supersector where things look pretty nice:

All of the p1 values, denoted by d(MIP)/d(day), have very little fluctuation from 0. Tiles 1-3 have a greater variance than the rest because the data set I was working with wasn't minbiased, so I had to do a centrality cut for those tiles (I believe it was ~ 50-100% range for centrality); this significantly cut down on the statistics available, but the p1 values still look fairly reasonable to me. If we pull an individual tile from here, say 22, we have the following graph:
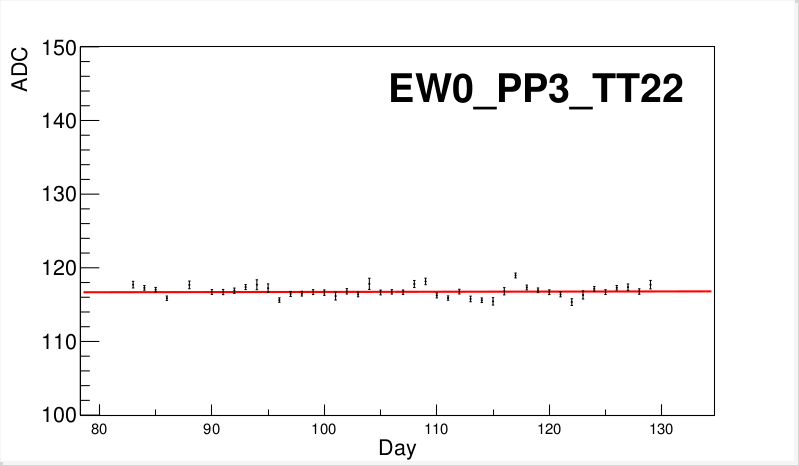
We can see the values for the nMIP peaks bounce around an average without much drama.
Let's now look at an example of a tile that doesn't have this nice of a fit.

We can clearly see tile 3 as the outlier here. Looking at the individual graph for tile 3 is the next step to see why it's so much farther away from 0 than the others:
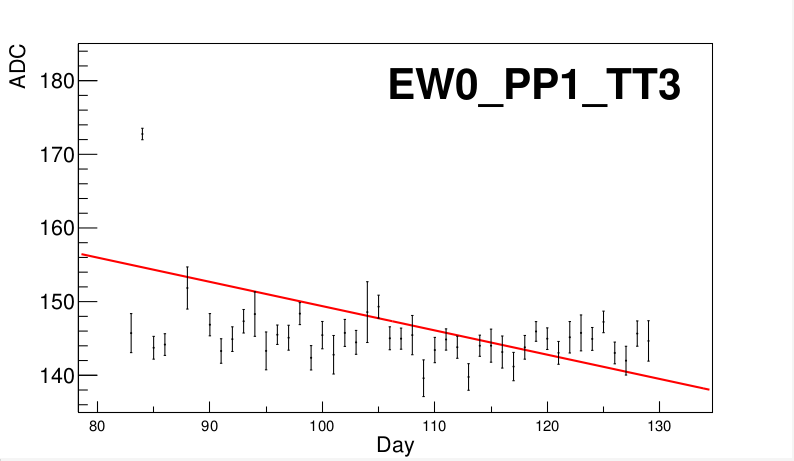
Here we can see that day 84 varies significantly from the other values. I will go back and hand-fit this day to see if it cleans up the statistics at all. This process will be repeated for any other tiles which seem to have this kind of variance. In this way, we can see if the variations are simply from a nonideal fit or if they're actually reflecting the phenomenon of the day/tile in question and need to be accounted for.
I have attached the pdf files for the complete set of graphs (from which the above images were pulled) as well as the text file for the data used. All are subject to change, but I do not plan to reupload better graphs and data here (rather; I'll make a new post once more progress is made).
- skk317's blog
- Login or register to post comments