EPD Calibration: Isobar (final)
Summary
The EPD calibration for the Isobar run has been completed. All files are included at the end of this post. nMIP values were determined on Day 83 (first day of the run) and then some were updated for days 88, 96, 97, 101, 102, 103, 106, 110, 115, and 118. Some of the tiles had very poor fits, but there didn't seem to be a trend of deviation (for example, West PP8TT22) so we simply took the average value. Other tiles had a group of days which fit one average and a second group which fit another (for example, East PP6TT21). For tiles like these we simply did a change in the ADC value for the different day ranges.
The code all works and can be easily adapted to other runs (for instance, I have tested it and found it runs fine on Au-Au 27GeV runs). This means we ought to be able to quickly calibrate future runs with little issue. That said, there is a memory leak issue being worked on that prevents the code from being truly plug and play at the moment, but we hope to have this worked out in the near future.
The Long Version
In order to calibrate the Event Plane Detector (EPD) for the 200 GeV, Isobar run using PicoDST data we have several steps to complete. These are, in order:
- Generate histograms for ADC vs counts for each tile for each day from the PicoDST data
- Fit those histograms with a multi-Landau curve and find the first nMIP maxima
- Check for fits that are poor and refit by hand
- Generate a text file with all values
- Plot X2/Ndf for all tiles (for a p0 polynomial fit) by plotting and fitting each tile for day vs nMIP
- Check fits that are poor and refit or otherwise rectify
- Amend the text file and enter values into the database
For this process, steps 3 and 6 are where the majority of the human labour is involved; the rest are fairly autonomous once one sets the paths from which one pulls the files being worked on by the macros.
Step 1-4: Generate Histograms and Fit
This step is completed by using the shell script RunAnalysis.sh. This script will iterate over the day range in question and generate histograms that will then be fit using a multi-Landau curve. When using the script, one must amend the following:
- Only run over days that are in the data set (you may have to run multiple times)
- in the macros called, make sure the paths are correct
The macro FindNmip.C will give two outputs for each day: a pdf file of each tile's ADC vs counts with the nominal value and the found value displayed, and a text file with the tiles and their found, 1st nMIP peak value and its uncertainty. The values that are "off" (either as having deviated too far from nominal or by having fits that didn't work) will be indicated in two ways. In the generated text file, lines will have a pointer that indicates a deviation or a poor fit. For example:
96 0 1 1 101.582779 1.437887 <---------- different from nominal
96 0 1 2 32.822273 43060680.000000 <---------------- Fit failed
Example of values where there was no indicated, poor fit:
96 0 1 9 157.068146 0.484558
96 0 1 10 117.049820 0.295594
96 0 1 11 117.783005 0.327757
96 0 1 12 116.609375 0.301349
96 0 1 13 118.125725 0.311102
96 0 1 14 116.290207 0.313975
96 0 1 15 115.903038 0.324507
96 0 1 16 116.466873 0.266413
The syntax in these text files is:
Day E/W PP TT ADC Err
"Day" is the day of the run, "E/W" is East (0) or West (1), "PP" is the supersector, "TT" is the tile, "ADC" is the found ADC value for the first nMIP peak, and "Err" is its associated error value.
There are 744 tiles for each day, so visual inspection of each tile for the entire run isn't feasible. Instead, one ought to look over tiles that have had poor fits indicated and see if they are actually incorrect or if the value is simply different than what we might expect. Here is an example of a good fit:
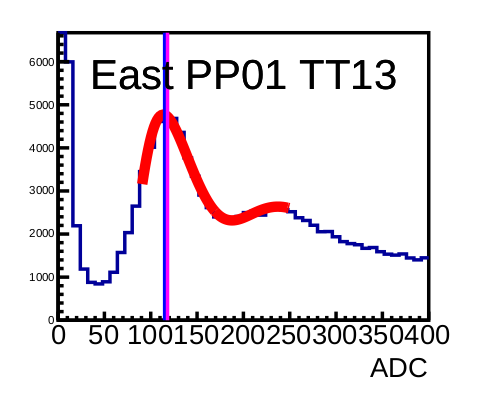
We can see that the found value (with a line in violet) is fairly close to the nominal line (in blue), and that it is pretty clearly at the peak of the first nMIP. This is ideally what we would like to see for all tiles for all days. An example of a poor fit would be:
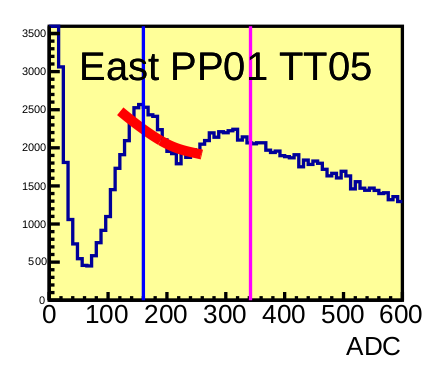
This fit would need to be redone by hand. Hand fits should be done by simply running FindNmips.C for a particular day, though I would recommend making a modified version of the file that changes the ranges for the fit and saves to a different location so that one doesn't overwrite the already generated file. For instance, the above examples were all taken from day 96 of the Isobar run. Refitting East PP01TT05 (say, in the ADC range of 100-400 instead of the normal range of 120-260) will also refit all of day 96 for other tiles and overwrite the previous file, but that file had the majority of the tiles fitting just fine. This would create a never ending issue which could only be solved by picking a fit range that worked equally well for all tiles, which is unfeasible.
Note: Many of the graphs included have significant issues for the first three tiles of each supersector. This is because the data was not minbiased. We used minbias data and it worked well, but another solution (which we had to employ as we had to regenerate the Picodst data and it was without minbias; we felt that correction of that oversight would have been too burdensome) would be to use centrality cuts and amend the macros to generate separate graphs for just the tile ranges that are problematic. This shouldn't be an issue for 27 GeV data or fixed target data.
###IMPORTANT###
We currently have a memory leak issue with the fitting function, FindNmip.C. In order to combat this, one would need to amend the shell script to include versions of the macro which only run over certain sides and supersectors. When I ran this on a machine with 8GB of RAM I had to separate the macro by side and by supersectors 1-6 and 7-12. Line 7 of RunAnalysis.sh would be amended to something like:
root -q -l -b "FindNmipEast1_6.C($i)"
root -q -l -b "FindNmipWest1_6.C($i)"
root -q -l -b "FindNmipEast7_12.C($i)"
root -q -l -b "FindNmipWest7_12.C($i)"
Where each of the new macros has the loop amended to only run the east or west side and the supersectors indicated. One would then also have to include a line such as:
cat /home/zandar/Documents/PicoHists/Isobar/Day%i/NmipConstantsEast1_6Day%i.txt /home/zandar/Documents/PicoHists/Isobar/Day%i/NmipConstantsWest1_6Day%i.txt
/home/zandar/Documents/PicoHists/Isobar/Day%i/NmipConstantsEast7_12Day%i.txt /home/zandar/Documents/PicoHists/Isobar/Day%i/NmipConstantsWest7_12Day%i.txt >
/home/zandar/Documents/PicoHists/Isobar/NmipConstantsDay%i.txt
This should all be one line in the shell script. You can, if you like, then remove the superfluous files; but it's not necessary. I also added the pdf files into single files by day, but leaving them as separate files is also fine. Note that here one should also ament FindNmip.C to save the files in a folder by day so the main folder doesn't get too cluttered (the above line additions assume that being done).
This will be unnecessary once the memory leak is plugged.
***UPDATE*** (1/15/2019)
The memory leak issue has been fixed. This was an issue with ROOT holding on to fit parameters that ought to have been dumped automatically in the loop, and was fixed in the latest update of ROOT. Now I can run the process on several processors at once without any memory issue. Joy.
Steps 5-7: Getting the Final Values
For this step we use another macro, DayFitsChi.C. There is a second shell script for this step that can be used whose purpose is simply to:
- Combine all txt files into a single file
- Run DayFitsChi.C, which generates the next set of graphs for review
This could, obviously, easily be done by hand with two commands; the shell script is there simply to consolidate steps.
DayFitsChi.C is used to fit every tile to a weighted average. This is done by fitting to a p0 polynomial with a TGraphErrors function. We then pull the X2/Ndf value for each tile over all the days and plot each supersector, as well as plot each tile over the days with the weighted average indicated. By looking over the X2/Ndf graphs, we can see if there are any tiles that stand out as having particularly poor fits and then investigate those tiles.
Here's a X2/Ndf graph for the East detector, Supersector 4:
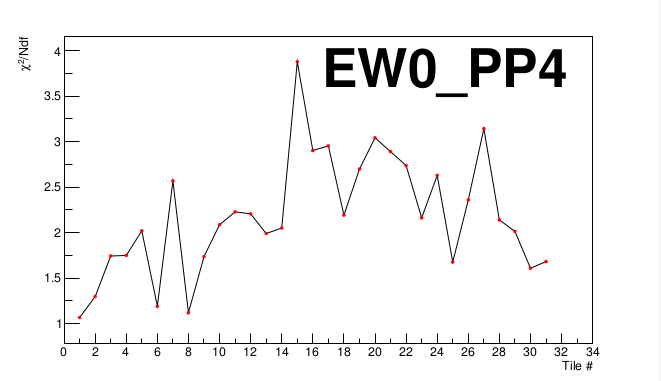
We can see that all values lie under X2/Ndf = 4. For our purposes, we decided that a X2/Ndf of around 5 or less was acceptable without reviewing the tiles. This is somewhat arbitrary, but it comes from looking over several tile graphs (nMIP vs day) and seeing that those which were visually satisfactory were under around the X2/Ndf = 5 mark.
For an example of a supersector which has tiles needing investigation, let's look at East PP11:
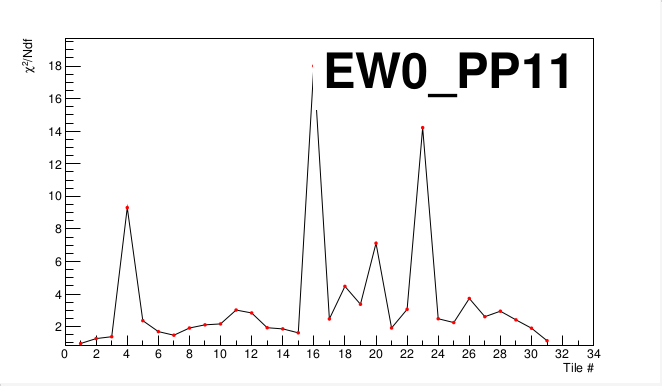
We see that tiles 4, 16, and 23 are very poor fits (also 20 could be a poor fit). Now we'll consider tile 16:
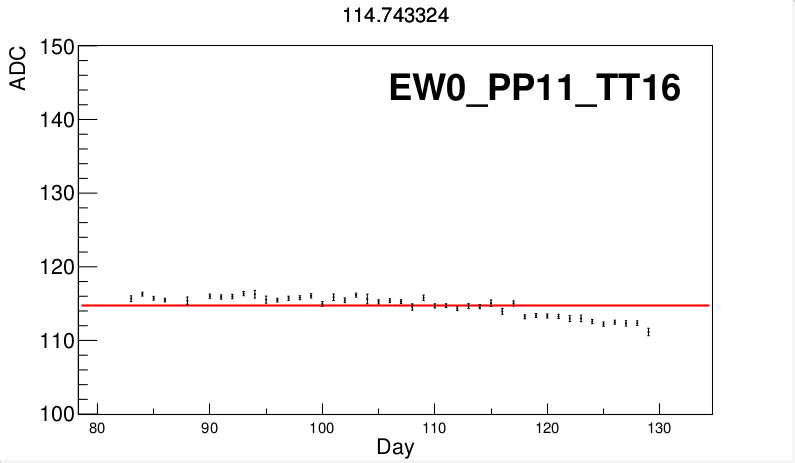
It's difficult to say exactly what's going on here; there could be a few factors which might cause the discrepancies, but for our purposes we'll simply focus on getting correct ADC values out of the graph. It would seem that fitting days 118-129 separately would at least give numbers more in line with what we're seeing here on the graph without having to resort to picking too many numbers. We could obviously take a different number for every tile for every day, but this wouldn't account for the fact that the fluctuations we see are most likely simply statistical fluctuations about an average and that, were we to use vastly greater statistics, we might be able to tighten up those values. In that line of thinking, the least amount of values for all days is to be courted; ideally, each tile would have a single ADC value for the first MIP over all the days.
When going over poor fit tiles, there are a few things that we can consider for getting values out of them:
- Was the original fit correct? Revisit it and see if it could be off, fix it if so, then rerun DayFitsChi.C.
- Is there an outlier with small error bars that's skewing the results? If so, perhaps give it its own value and fit the rest (using DayFitsChi.C) without it for another average.
- Is there a pattern of days that are off? If so, fit those days separately.
- Is there no pattern, and values are all over the place? Consider simply taking the average value as the alternative is a different value for each day.
Bear in mind that, when the values are entered, we will simply enter a tile's value if it changes. For the Isobar run, we have everything starting on Day 83. So we enter in values in the database for all 744 tiles for Day 83. Let's say that, on Day 84, only tile EW0PP4TT16 had a different value. Then we would only enter in that tile for Day 84 and all else would remain constant. This is important for our fits. If we have a tile where, say, days 83-90 and 102-129 all appeared to have one, fairly consistent value, but days 91-101 appeared to have a lower value. It would be tempting to fit days 91-101 separately and then {83-90, 102-129} together. But when entering values in the database we would enter a value for day 83, then another for day 91, then a final value for day 102. Since we're already changing the value twice, it makes more logistical sense to fit days 83-90, 91-101, and 102-129 as separate groups.
Once we have satisfactory values for all tiles, we need to generate text files with the same structure as above but without the error value. We will have a value for all tiles for the first day, then only files and values for subsequent days which have had changes. In an ideal world, all of the electronics behaved homogeneously throughout the run and none of the statistics fluctuated too badly so we'd have but a single file to enter. In our case, we had eleven files to use over the forty-five days (not too bad). Most of the files (attached) have very few values to enter.
Next Steps
This process is complete for Isobar, and it can be used in its current form for calibration of any of the runs. That said, there are a few places where it can be improved upon and streamlined. First, the memory leak issue with FindNmips.C. We have this localised and it seems to be an issue with ROOT keeping a background histogram for the fits performed that do not clear when looping over a lot of values. We hope to eliminate this soon as this will speed up the process and make it so we don't have to split up processing those fits. Second, there is a fit range that I found would often work very well for tiles that had either poor or failed fits. I'm going to modify the FindNmips.C macro to account for this and, when we have a failed fit at least, use the other range and re run that tile. This should eliminate some of the human review work when going over fits and speed up the process a bit more. Third, the end process of generating the text files is very tedious as I did it in Excell. We needed values, and it was quicker for me to do it by hand than to have a macro run it over and do it for me. This was very slow and could be error prone, so having a program do it instead would be much better (the same could be said for entry of the values for "fixed" fits in steps 2-3; this is another area where we could streamline).
I'd ideally like to have a process where there are essentially three "button presses;" one at the start to generate fits, one after getting proper fits, and then one at the end to generate the final text files. The only points of huan interaction would be where it makes sense to have it: review of the initial fits of the nMIP peak and review of the X2/Ndf values for final ADC numbers. Right now we're close to that, but there are a few points (outlined above) where we would be better served having a computer rather than a human do the heavy lifting. The other area that I'm not sure we could automate (or it might simply not be worth it) is in changing path locations in the shell scripts and macros. Also, the current shell scripts make one have to distinguish between double digit and single digit days; this could be eliminated with a simple "if" logical structure (as is currently employed in PrashRunAnalysis.C).
As a final note, there are a few scripts I've included like Folders.sh. These were used to simplify the organisation process and are not necessary for running the calibration. Indeed, there are probably more logical and efficient structures one could use, so I include them here more for completeness than anything else.
- skk317's blog
- Login or register to post comments