run 15 ETOW slope outliers
19 emc-check runs, each with ~100k events, were used:
16044108
16045041
16045076
16045160
16046030
16047001
16047093
16048010
16048083
16048108
16049009
16050003
16051100
16052011
16052086
16053072
16055001
16055119
16056015
Figure 1: Some examples of typcial fits to tower adc distributions. (note: entries are weighted from a 4096-bin histogram)
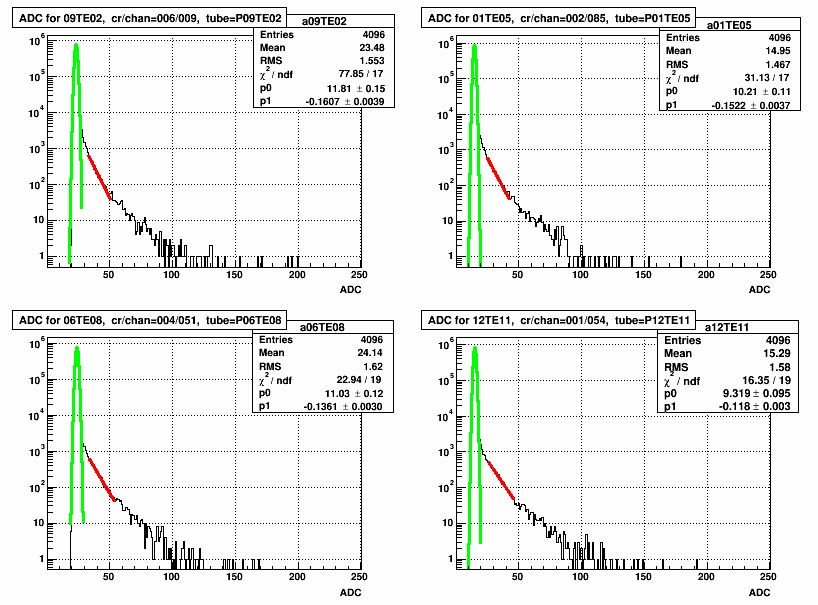
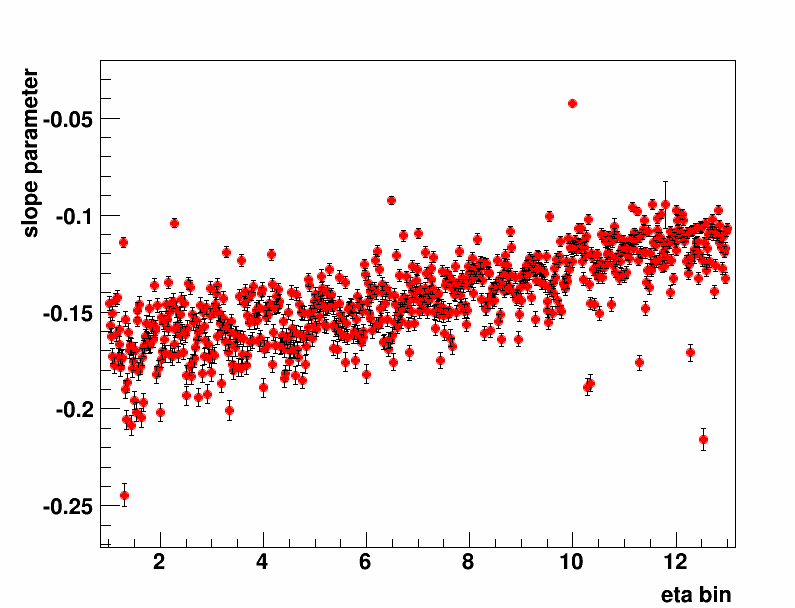
Figure 1 shows fits to the pedestal and tail of tower typical adc distributions. The slope parameter of the tail is used as a simple proxy for the gains. The slope parameter is plotted vs eta bin of the tower in figure2, where we look for towers that are operating but whose slopes are outliers.
Figure 2: Slope parameter from fit to the adc distribution for each tower.
These towers have irregular or empty distributions(see attachment below) and are not plotted in figure 2:
| 02TA01 |
| 02TC04 |
| 02TC06 |
| 06TA03 |
| 07TC05 |
| 10TC02 |
| 10TC03 |
| 10TC09 |
| 11TA08 |
| 11TB08 |
| 12TD01 |
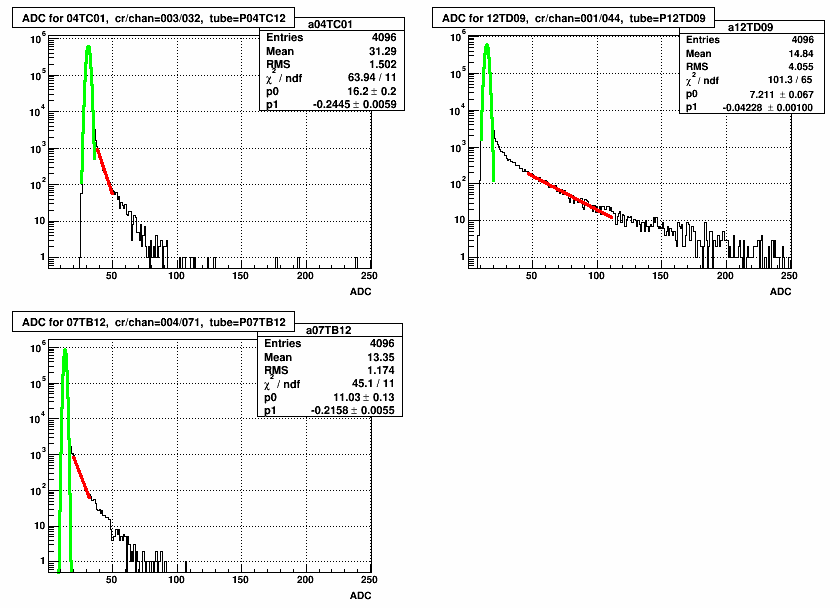
Figure 3: Other potential outliers.
- skoby's blog
- Login or register to post comments