IFF 500 GeV and 200 GeV comparison
Updated on Thu, 2015-09-24 13:32. Originally created by skoby on 2015-09-24 10:54.
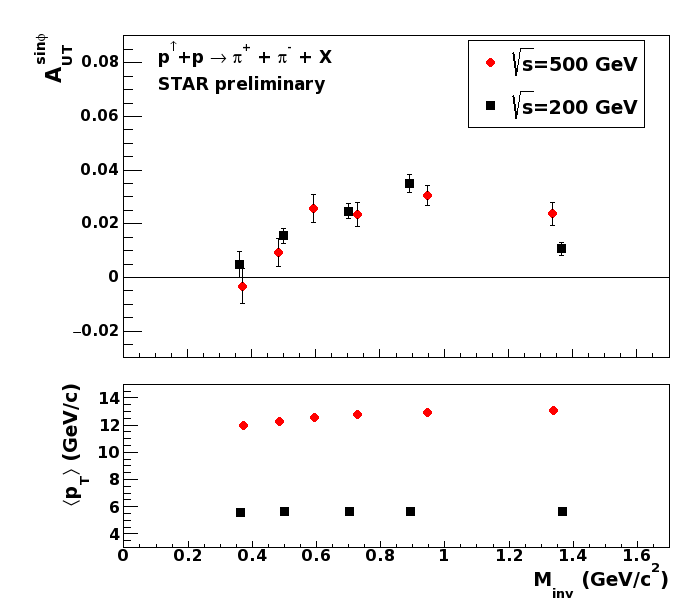
Same as previous plot expect the bottom panel has been scaled by the collision energy: <p_T>/sqrt(s)
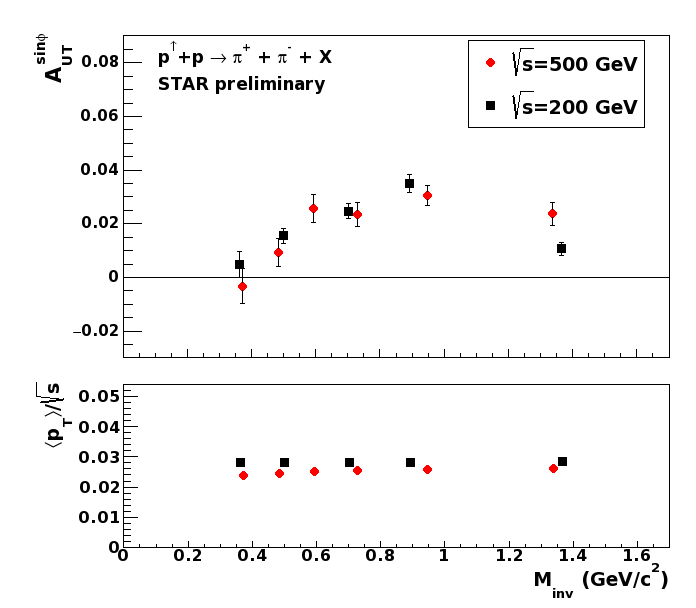
Asymmetry from 500 GeV(Mike) and 200 GeV(Keith) combined on one plot. Average pT of 200 GeV results is about a factor of 2.25 smaller than the pT of 500 GeV results. <pT>_200GeV ~ 5.6, <pT>_500GeV ~ 12.6
»
- skoby's blog
- Login or register to post comments