Quick Look at Sti Hit Efficiency
For this study I consider Sti nodes associated with active IST Sti detectors. The following distributions are built using the real data. All dimensions are in cm
At this point there are no special cuts on track or hit quality except for:
- number of TPC hits is greater than 30
- the track is required to cross an IST active layer
Synopsis: At the moment, the plots show that with a great certainty the reconstruction algorithm picks up the hit closest to the mean track projection. My current estimate for finding the right IST hit is ~80%. Sti might be loosing hits due to something that is not related to hit being too far from the track projection.
It looks like increasing the 5-sigma search window would not increase the efficiency. The QA results for tracks with IST hits need to be revisited to confirm that the track quality was really degrading.
The problem with unphysical Sti nodes outside of volumes still remains unsolved.
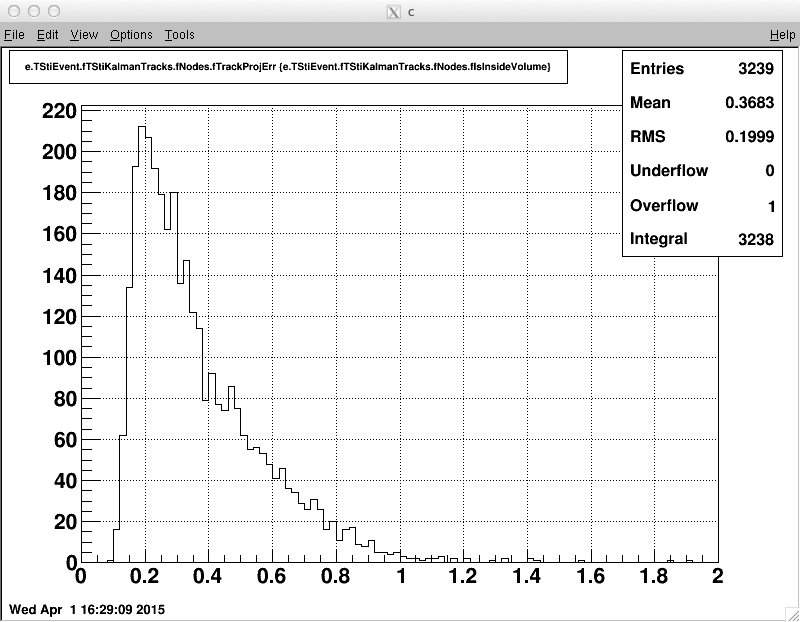
- The track projection error on to IST layer
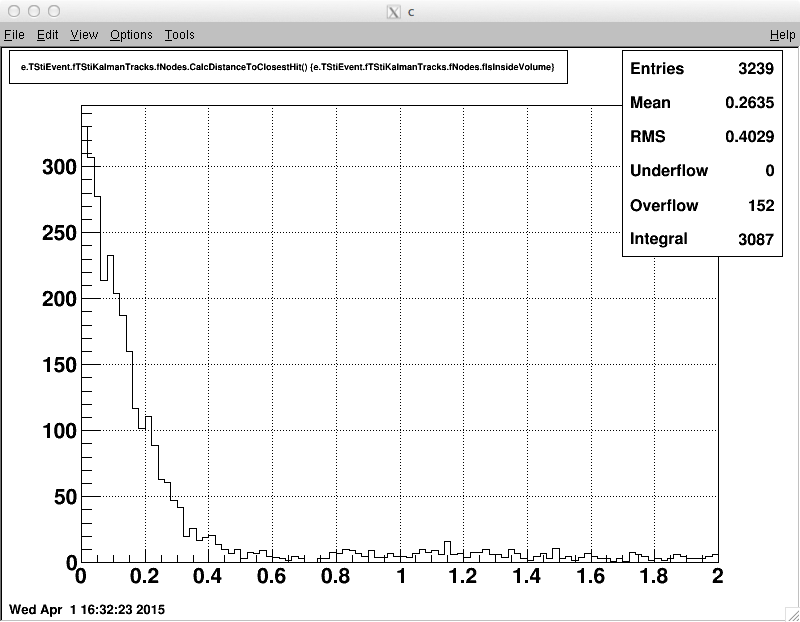
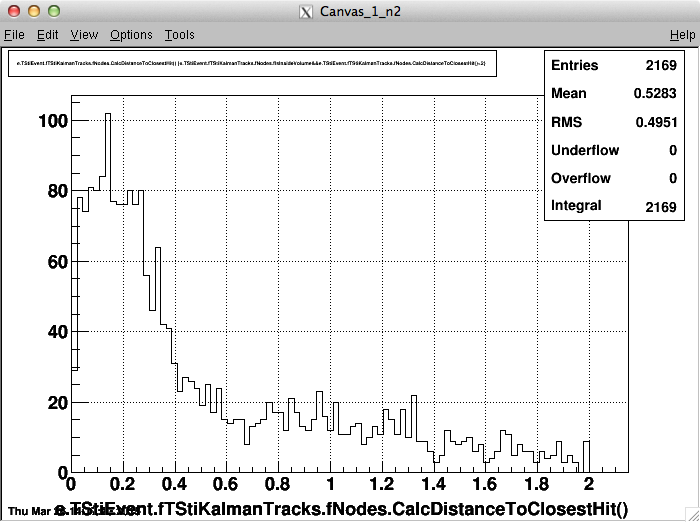
- 3D distance from the node position (i.e. mean track projection) to the closest hit for IST
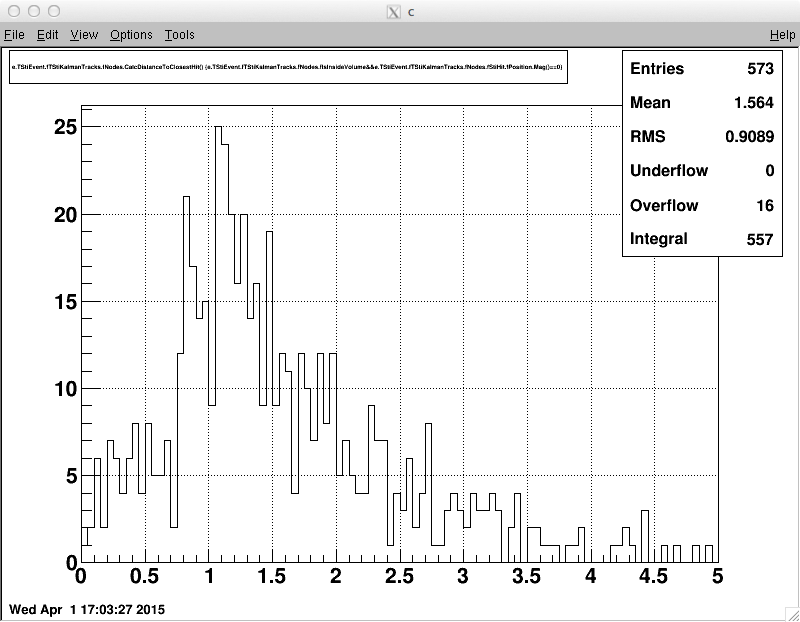
- 3D distance from the node position (i.e. mean track projection) to the closest rejected hit for IST
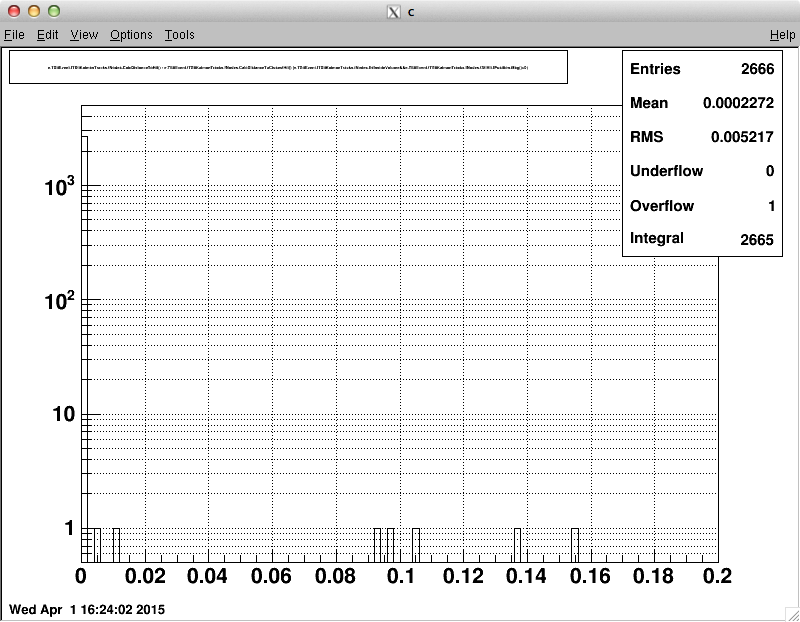
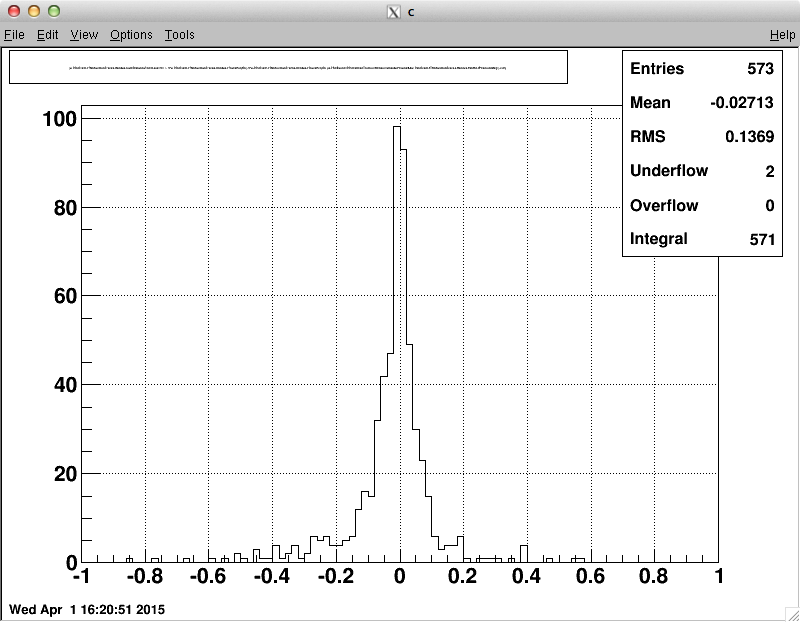
- Difference in distance between the actually picked and the closest hits. Only in ~0.3% of all cases Sti does not pick up the closest hit. This may be related to the fact that Sti searches for hits only associated with the projected Sti detector, i.e. the hits may be closer to the track projection but they can belong to a neighboring Sti detector
- Relative difference between the distance to the accepted hit and the (5 x projection_error) )
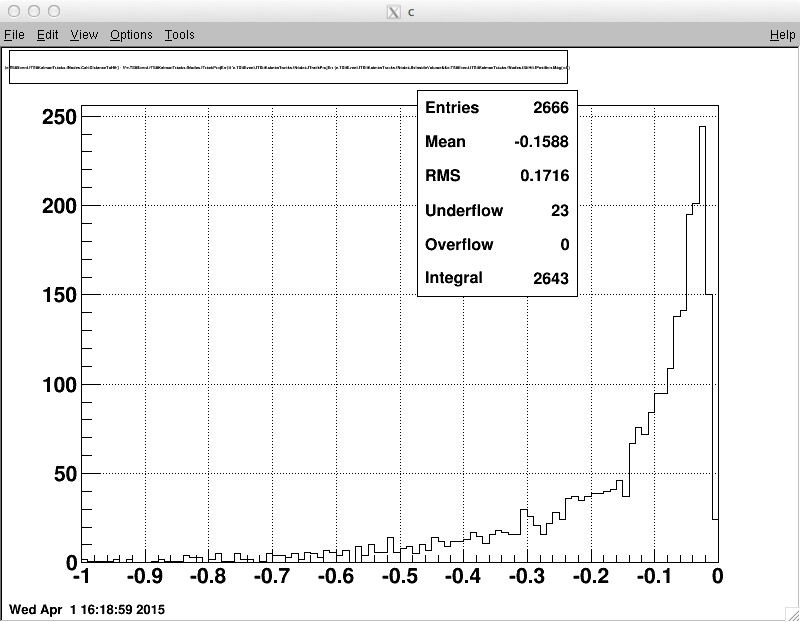
- Relative difference between the distance to the closest rejected hit and the (5 x projection_error) (Sti nodes without assigned hit)
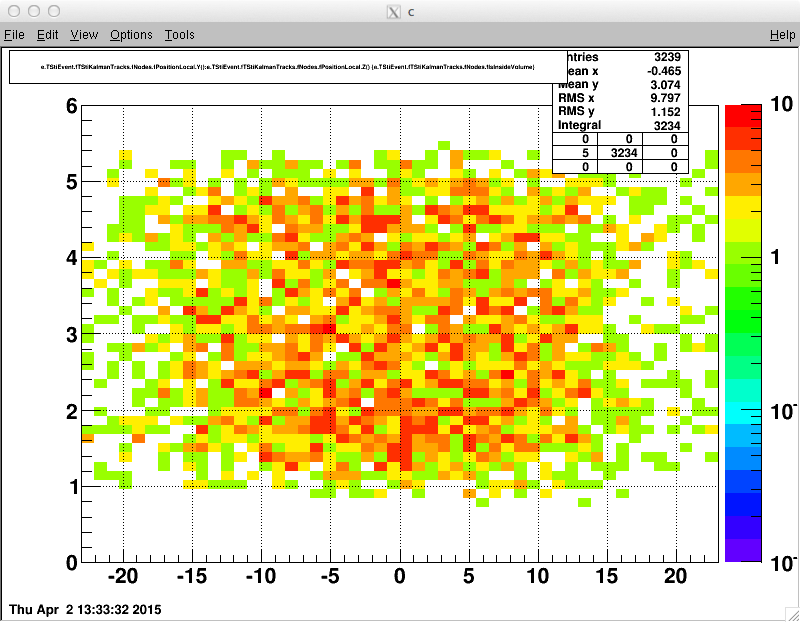
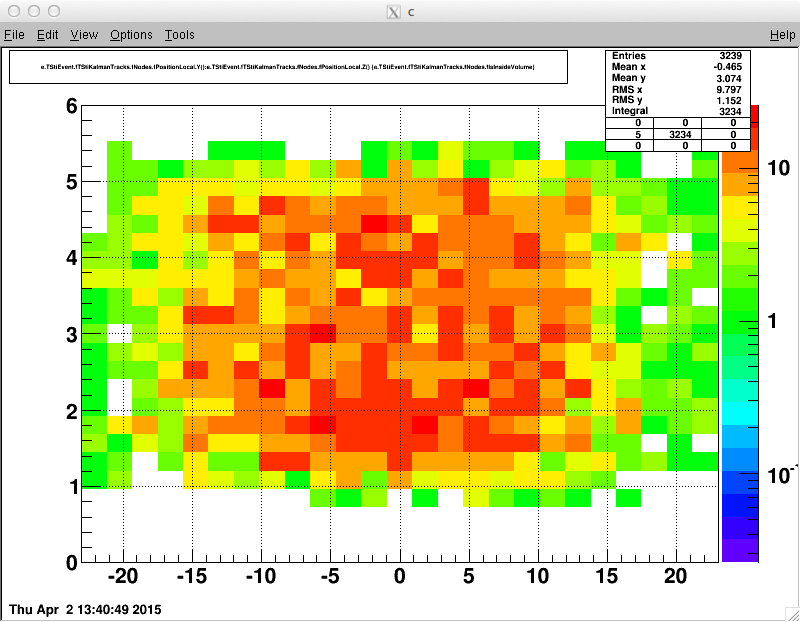
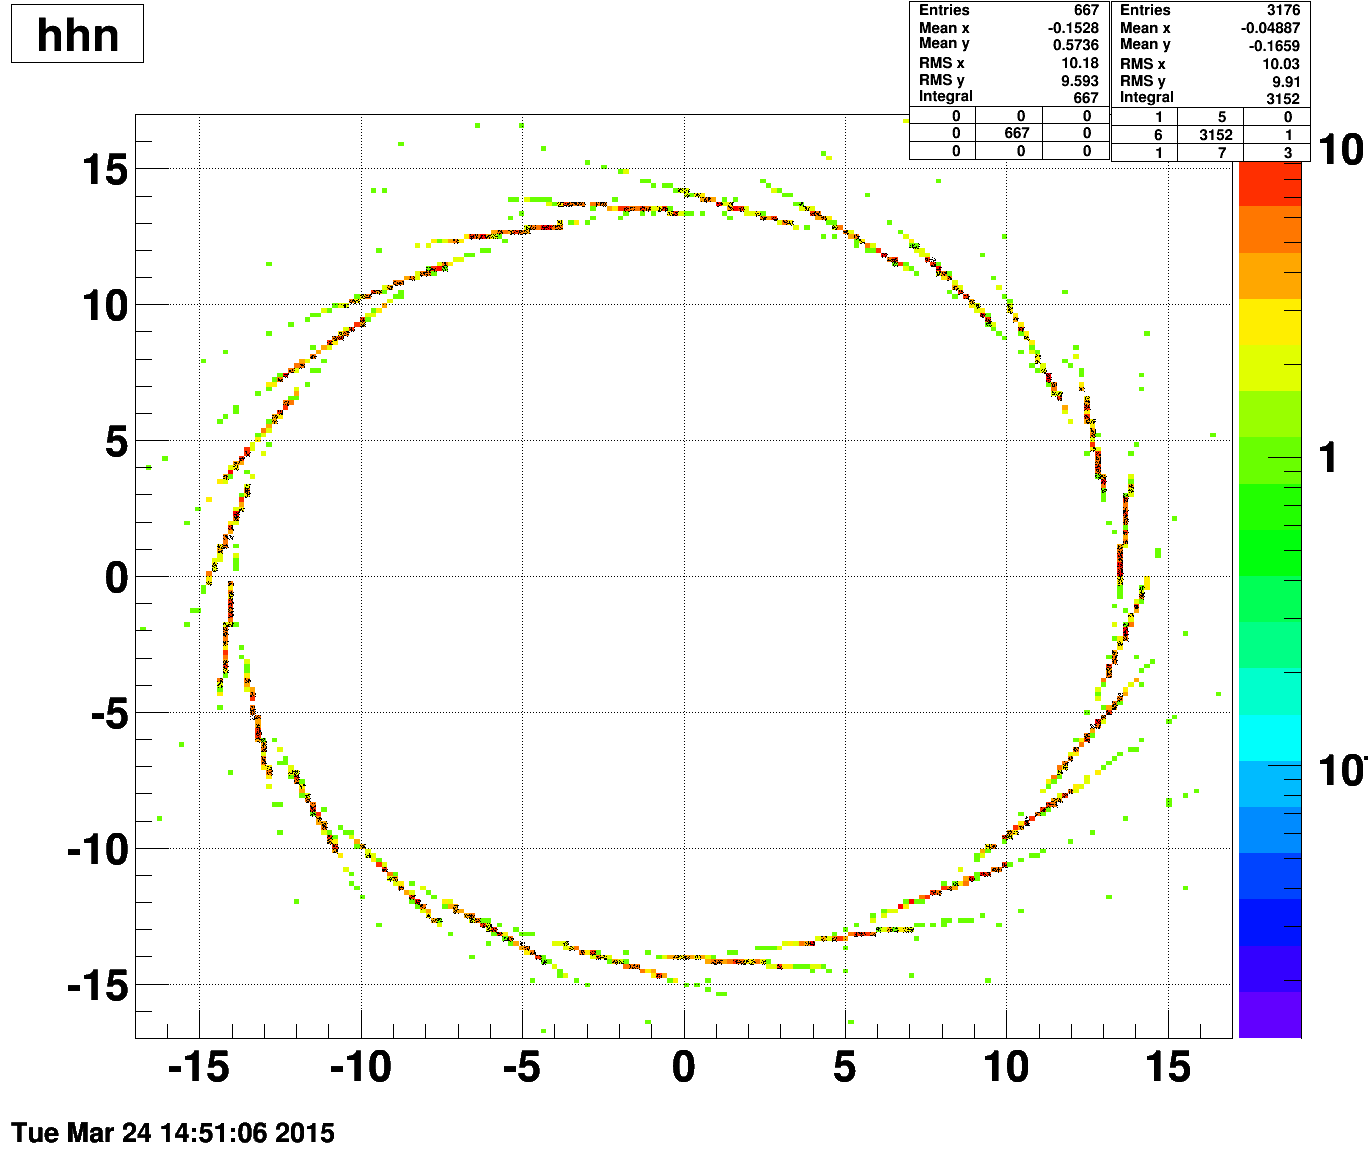
- Y vs X of the selected nodes
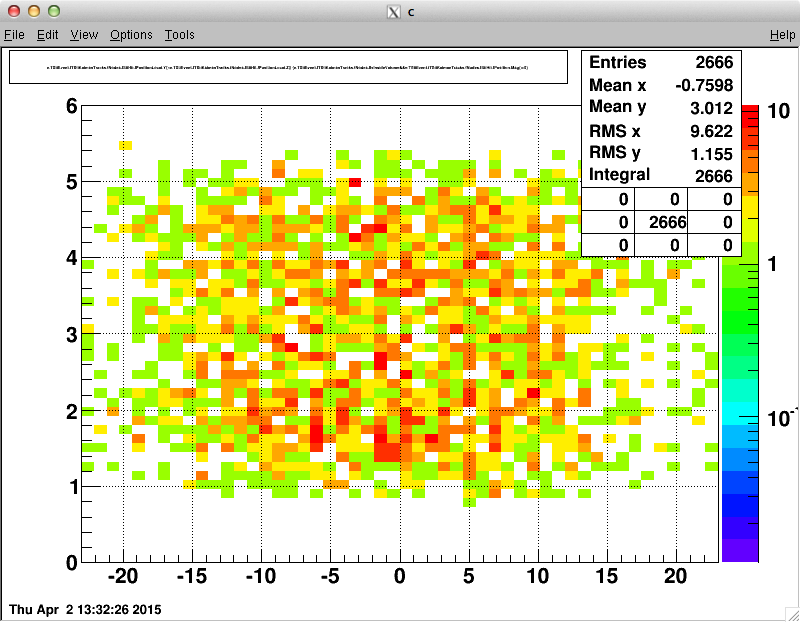
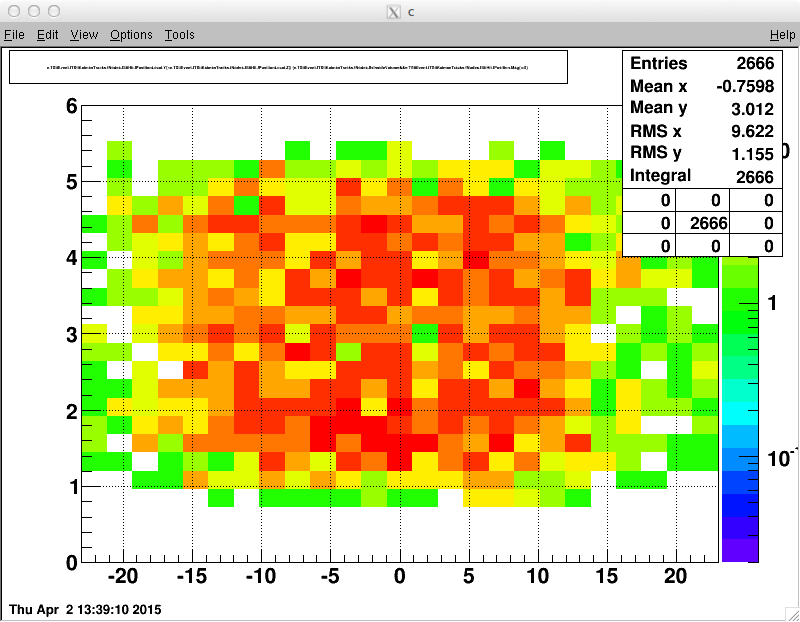
- Y vs X of the hits associated with selected nodes. The total fraction of associated hits is ~80%
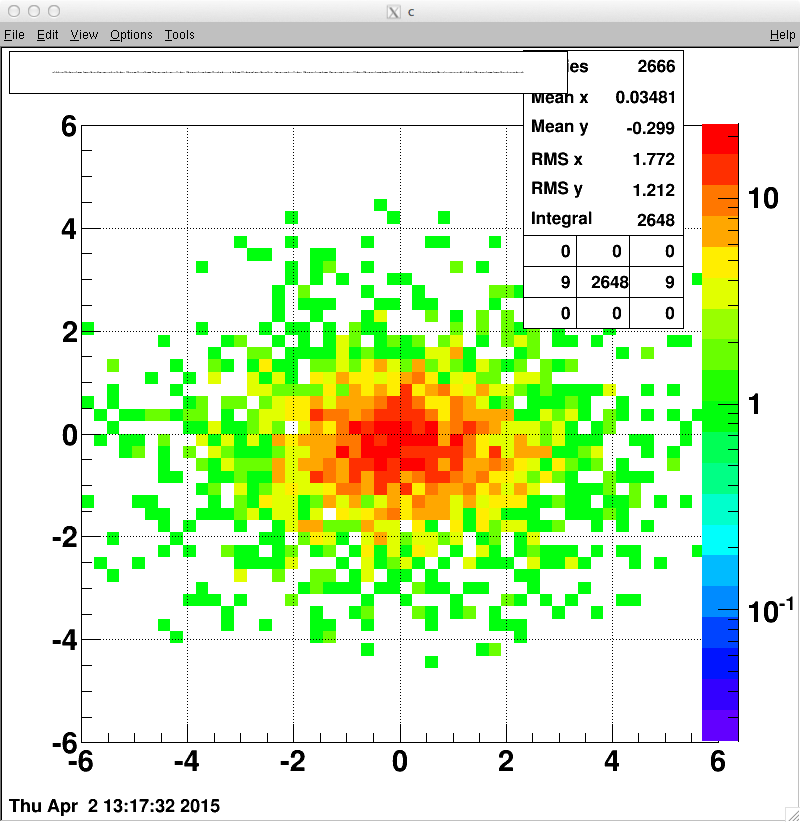
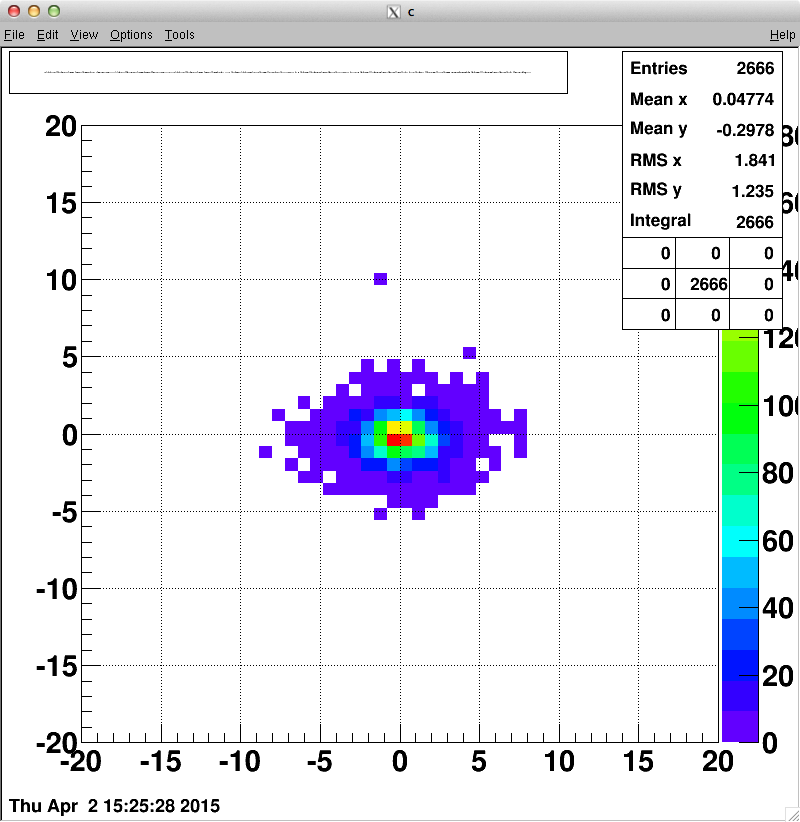
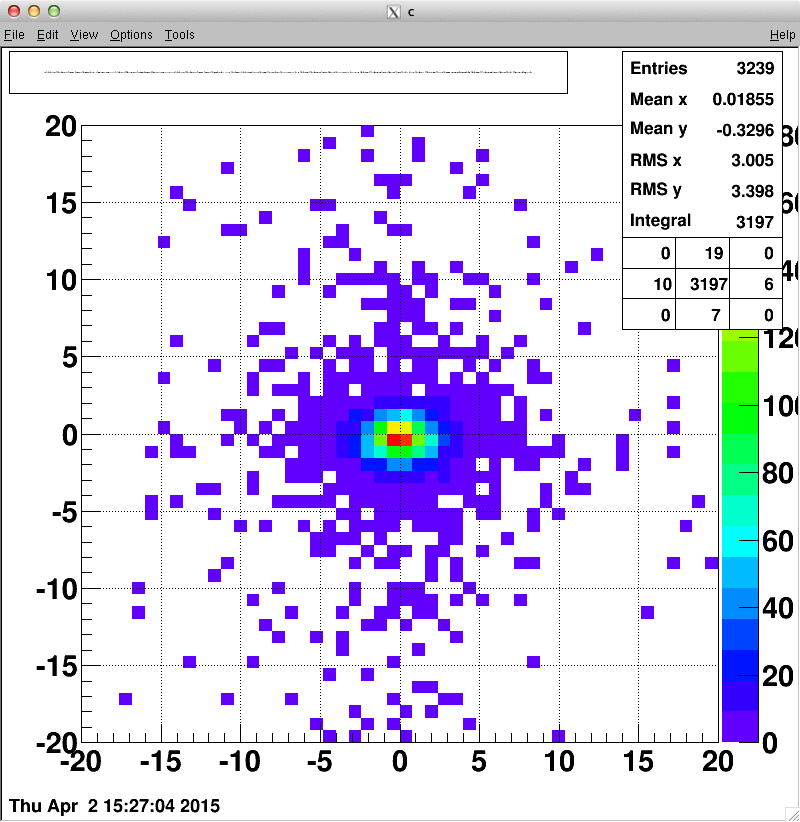
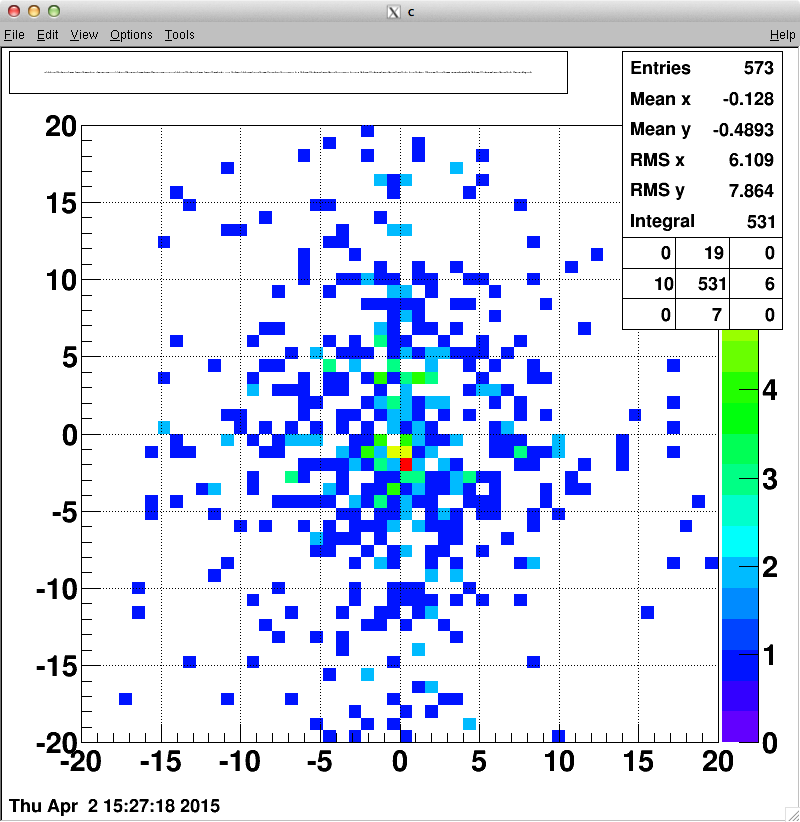
- 2D pull distribution. The mean track projection is placed at the center of coordinates. All axes are in relative units of track projection error, i.e. values are in sigma units
Accepted hits (first and second plots just have different axis range), all closest hits, rejected hits
- Sti node position in local coordinates
- Sti hit position in local coordinates
Support Plots
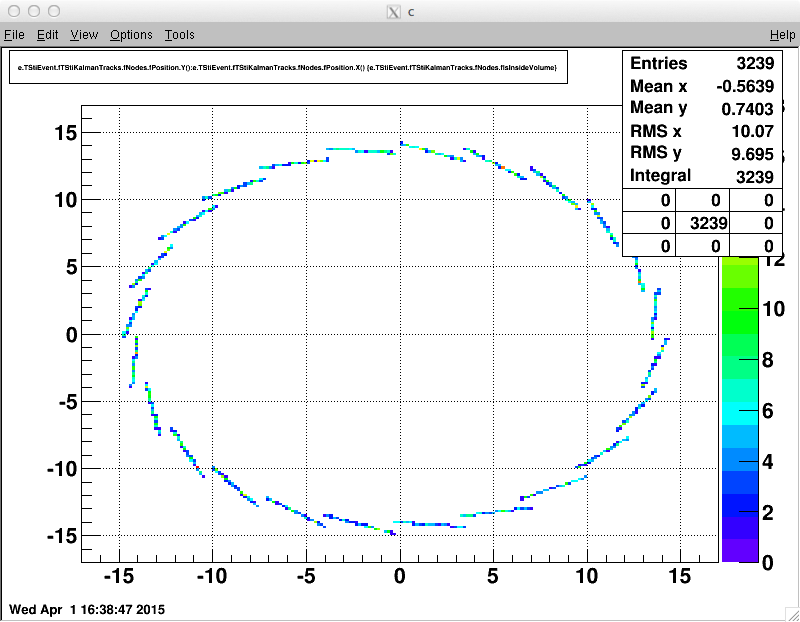
- The color histogram shows the XY position of Sti nodes associated with the IST
The black scatter histogram shows the position of Sti hits associated with some of the Sti nodes
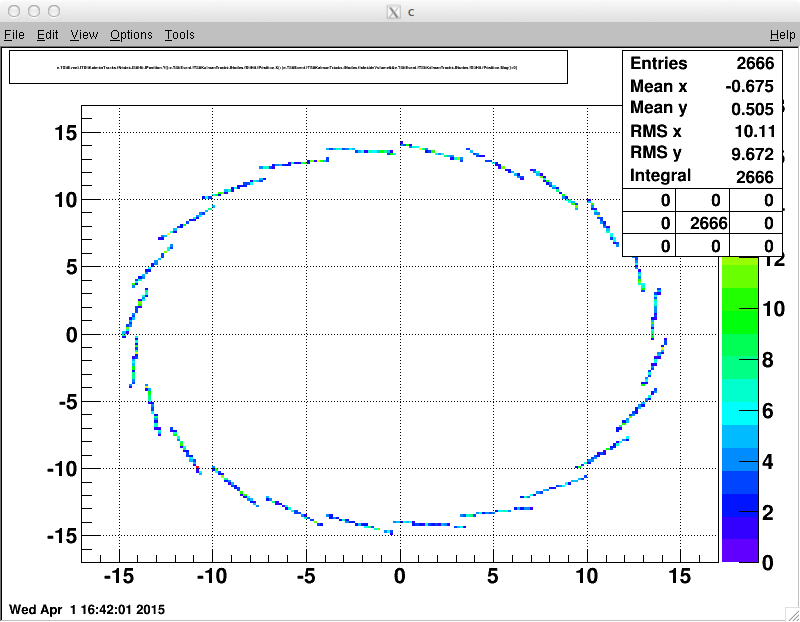
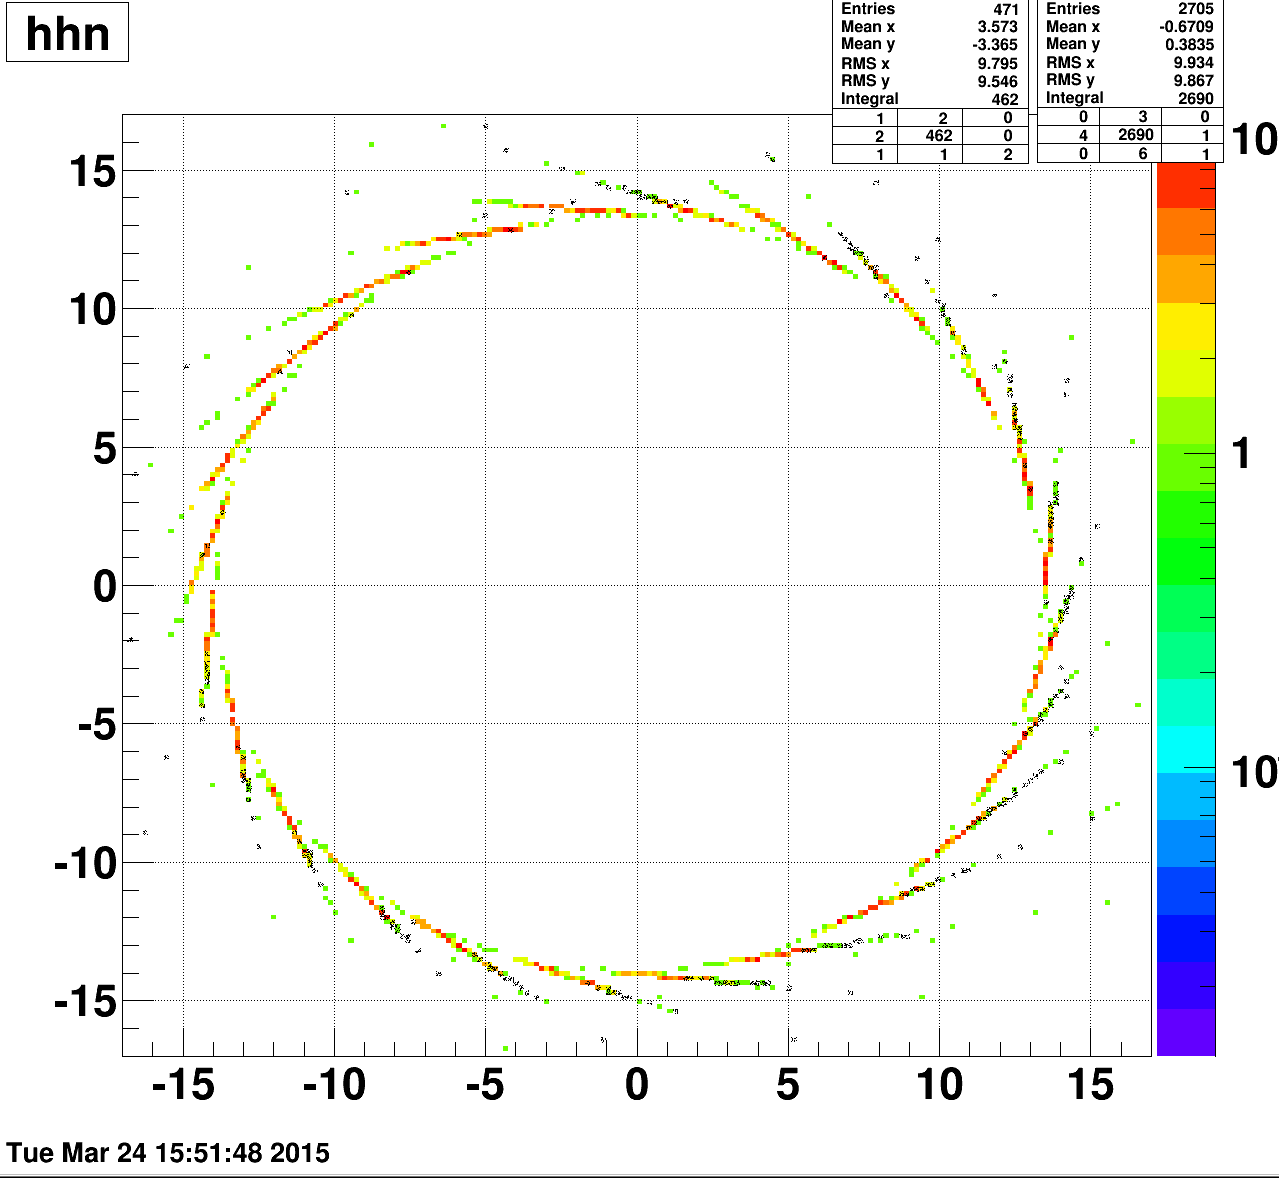
- The color histogram shows the XY position of Sti nodes associated with the IST
The black scatter histogram shows the subset of Sti nodes which have positive energy loss associated with them
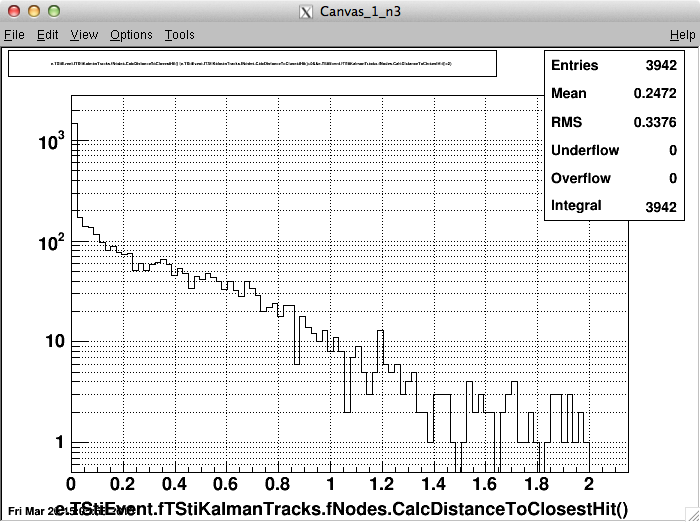
- 3D distance from the node position (i.e. mean track projection) to the closest hit for IST (left) and PXL1/PXL2 (right)
- smirnovd's blog
- Login or register to post comments