S&C Meeting, August 20, 2014
Updated on Wed, 2014-08-20 10:55. Originally created by smirnovd on 2014-08-20 10:06.
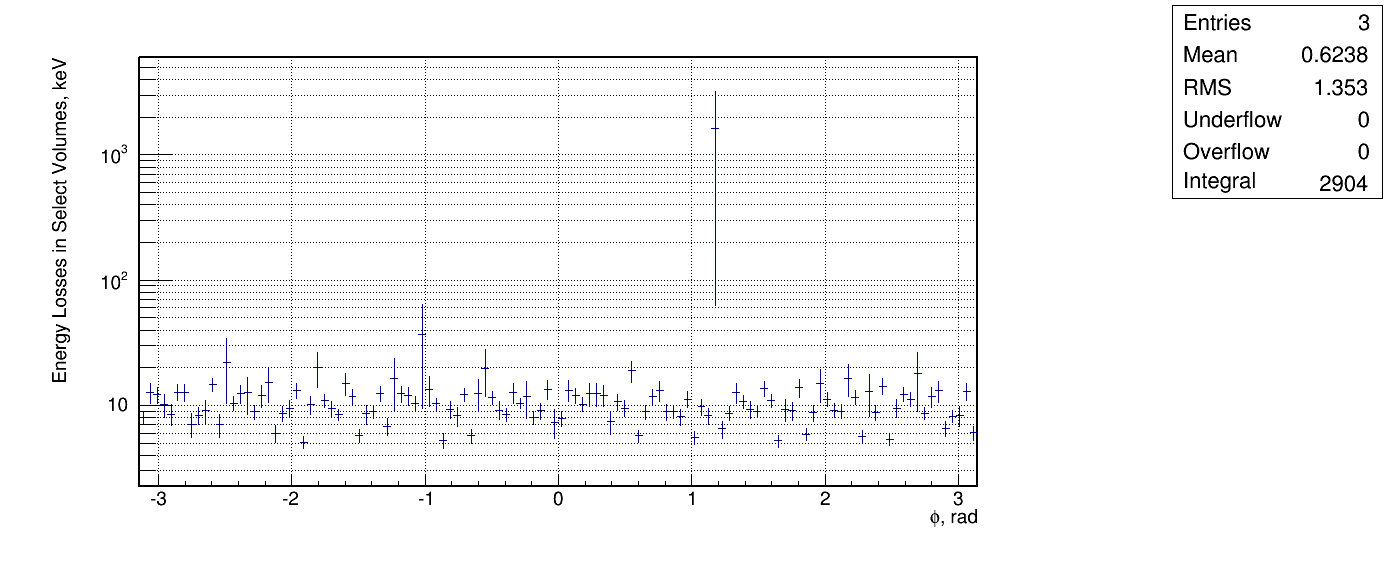
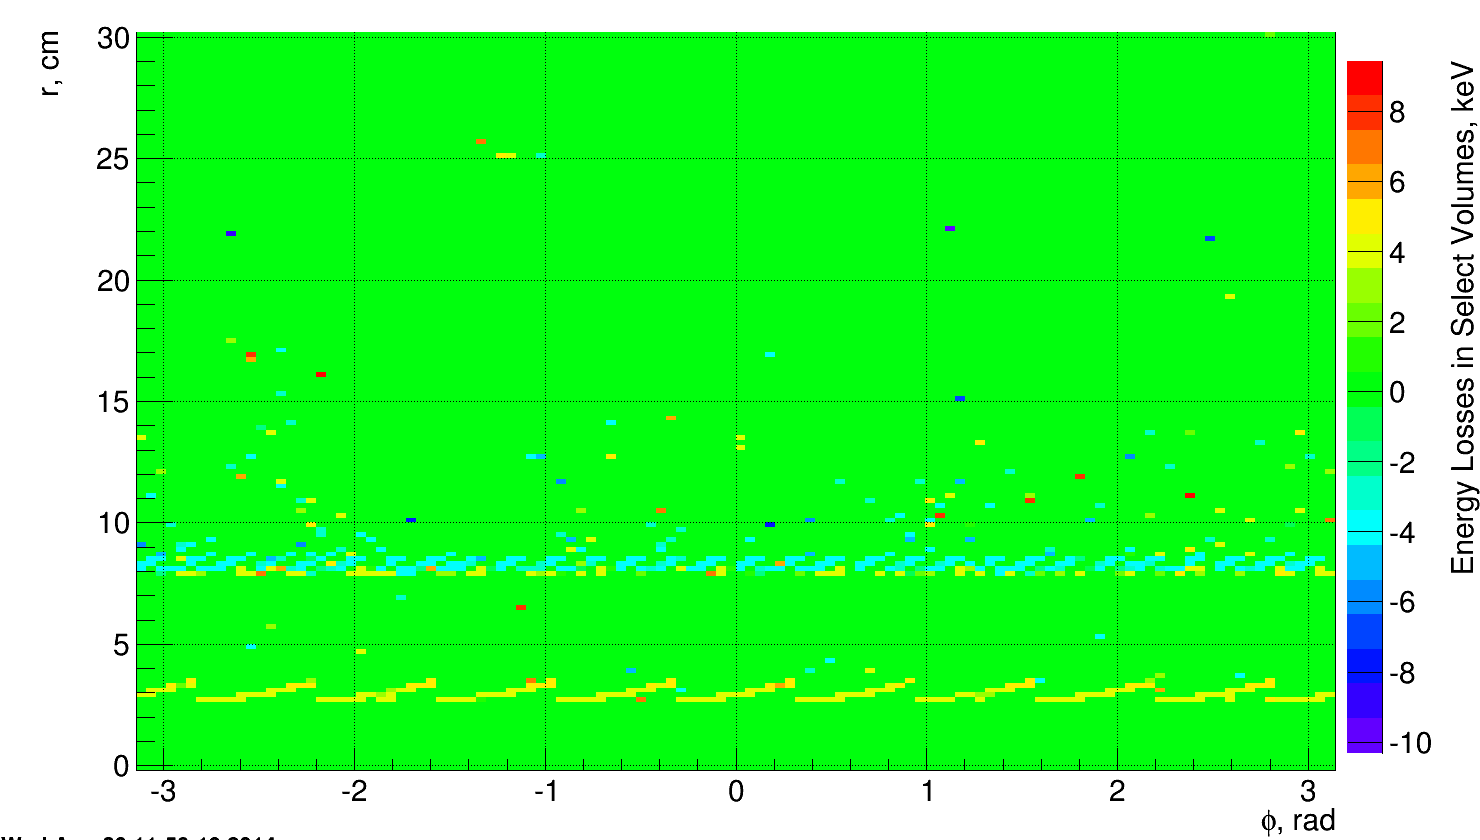
Energy losses as seen by Geant and Sti. The following plots use data from a single slice at z=+5 cm
PXL Sensitive Layers
Only the sensitive PXL and IST volumes were selected matching the following patterns:
"^.*IDSM_1/PXMO_1/PXLA_[\\d]+/LADR_\\d/PXSI_[\\d]+/PLAC.*$"
| Geant | Sti (dE = dE_previous_node/2 + dE_gas_in_between + dE_current_node/2) | Sti (dE = dE_current_node) |
|---|---|---|
.png) |
.png) |
.png) |
 |
.png) |
.png) |
IST Sensitive Layers
Only the sensitive IST volumes were selected matching the following patterns:
"^.*IDSM_1/IBMO_1/IBAM_[\\d]+/ILSB.*$"
| Geant | Sti (dE = dE_previous_node/2 + dE_gas_in_between + dE_current_node/2) | Sti (dE = dE_current_node) |
|---|---|---|
.png) |
.png) |
.png) |
.png) |
.png) |
.png) |
Opposite sign energy loss. The above plots show the absolute values for eloss in the node
.png)
»
- smirnovd's blog
- Login or register to post comments