- sra233's home page
- Posts
- 2019
- January (1)
- 2018
- 2017
- December (4)
- November (1)
- October (1)
- August (1)
- July (1)
- June (1)
- May (2)
- March (1)
- February (3)
- January (4)
- 2016
- 2015
- December (2)
- November (2)
- October (1)
- September (2)
- July (1)
- June (2)
- May (2)
- April (4)
- March (4)
- February (5)
- January (4)
- 2014
- December (3)
- November (3)
- October (3)
- September (2)
- August (1)
- July (3)
- June (1)
- May (3)
- March (1)
- February (5)
- January (2)
- 2013
- 2012
- My blog
- Post new blog entry
- All blogs
Phi vs pT - Run 12 - 500GeV/200GeV
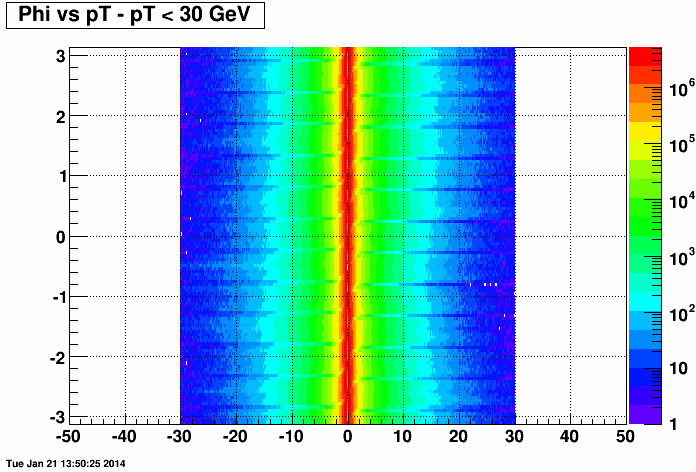
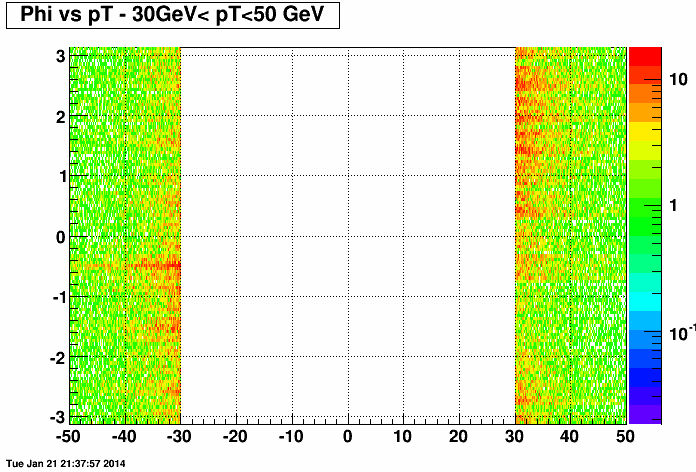
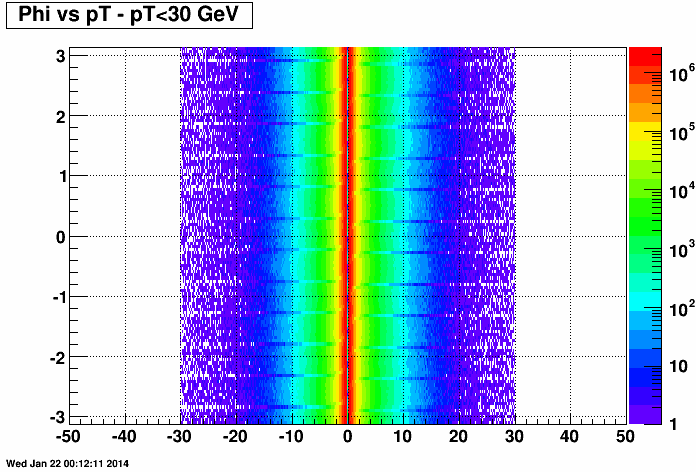
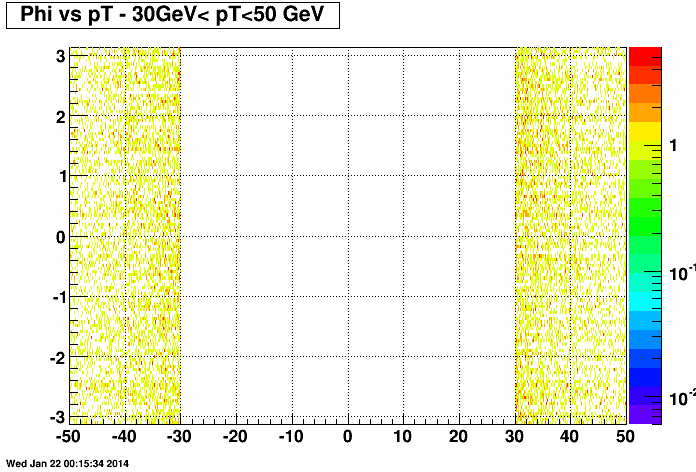
The following plots depict track phi versus track pT , for pT<30 GeV (Figure1) and for 30GeV<pT<50GeV (Figure2), both East and West regions of the TPC combined. The tracks on the East side are plotted on the negative x-axis. Figure 1 and Figure 2 are for 500 GeV and Figure 3 and Figure 4 are for 200 GeV :
Figure 1

Figure 2

Figure 3

Figure 4

Groups:
- sra233's blog
- Login or register to post comments
