- stevens4's home page
- Posts
- 2014
- 2013
- 2012
- 2011
- December (1)
- November (2)
- October (1)
- September (1)
- August (2)
- July (3)
- June (7)
- May (2)
- April (2)
- March (5)
- February (2)
- January (2)
- 2010
- November (1)
- October (1)
- September (3)
- August (3)
- July (3)
- June (1)
- May (1)
- April (3)
- March (4)
- February (4)
- January (8)
- 2009
- December (4)
- November (3)
- October (4)
- September (5)
- August (1)
- July (2)
- June (2)
- April (1)
- March (1)
- February (2)
- January (1)
- 2008
- My blog
- Post new blog entry
- All blogs
Pre-embedding QA for W analysis: Calorimeters
Pre-embedding QA for W analysis: Calorimeters
Goal: Confirm that calorimeter (BTOW and ETOW) ADC data are compatible in real data and MC events.
Data Samples:
- Data: VPD minbias data from pp500 (Fill F10471) -> 782258 events
- MC events: Pythia minbias MC generated with -> 265000 events
- geometry = y2009a
- CKIN 3=-1 CKIN 4=-1
- No LOW_EM option used
- EEMC and BEMC simulators "as is" (Slow Simulator included for ETOW)
- The gain tables used to convert geant energy -> ADC are the same as will be used for real data
- Time to generate: GSTAR ~ 6s/event and BFC ~ 0.5s/event (TPC not included)
To confirm the compatability of the gains for MC and data, I used "Scott's Method" to fit exponentials to the ADC spectrum for both data and MC to find slopes. These slopes are proportional to the gain for each tower. Below I show the ratio of the these slopes for each tower. This ratio (MC slope / data slope) should be ~1 if the gains are the same for both samples.
BTOW
Figure 1: Example BTOW ADC spectra (Data on the left and MC on the right)
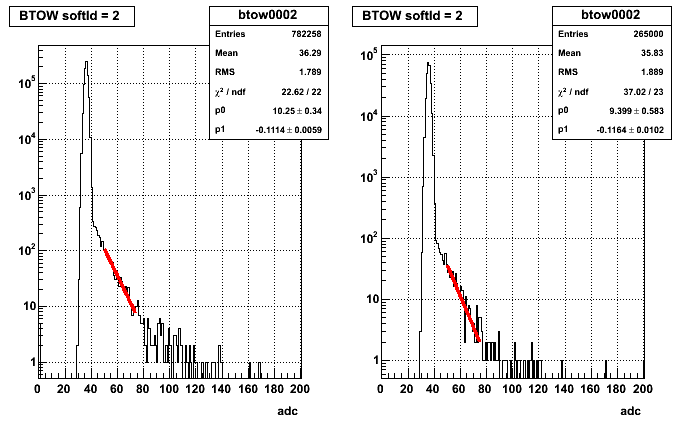
Figure 2: BTOW slope ratio and error (log scale)
.png)
Since the BEMC simulator Sampling Fraction has an eta dependence, I need to seperate this into eta bins, where the ratio should be more constant for each bin. Attached below is a pdf file with each eta bin plotted seprately ( etabin [0,39] -> physical eta [-1,1] ).
Figure 3: BTOW log(slopeRatio) fitted with gaussian
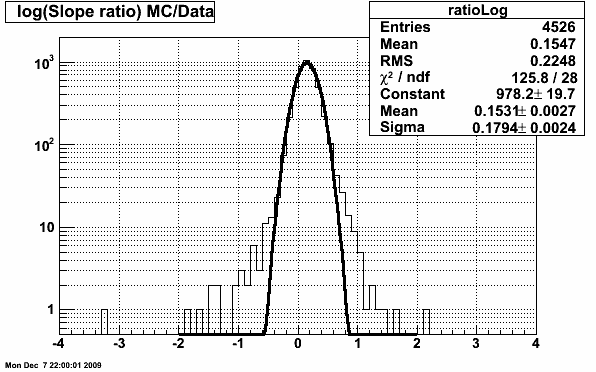
List of towers outside 3 sigma away from centroid is attached below.
| # Sigma from Centroid | # towers | % of total | % expectation |
| 1 | 1378 | 30.4 | 32 |
| 2 | 327 | 7.2 | 5 |
| 3 | 115 | 2.5 | 0.3 |
So the distribution in fig 3 is fairly gaussian, but outside of 3 sigma from the mean there are more outliers.
Below are 2 plots of towers that fall outside 3 sigma from the centroid (again data on left and MC on right).
Figure 4: BTOW softID=2391
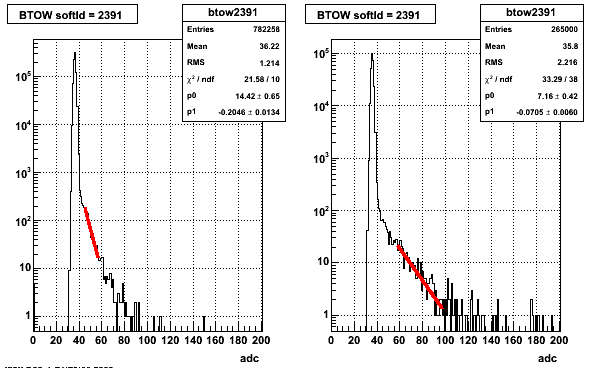
Figure 5: BTOW softID=3515
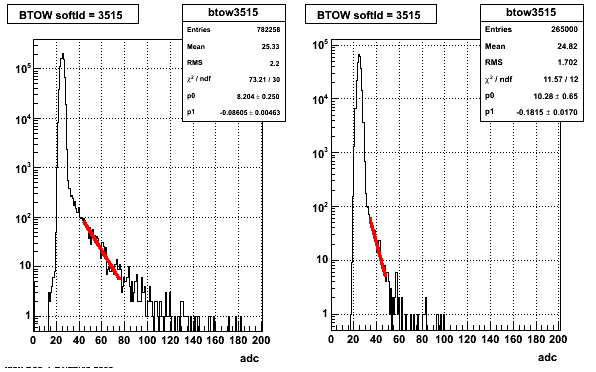
The spectra don't necessarily look "bad" and the fits seem reasonable for these 2 towers, but the slopes are very different. Not sure what to say about these.
Figure 6: log(slopeRatio) - centroid for each tower (3 ranges of differences)
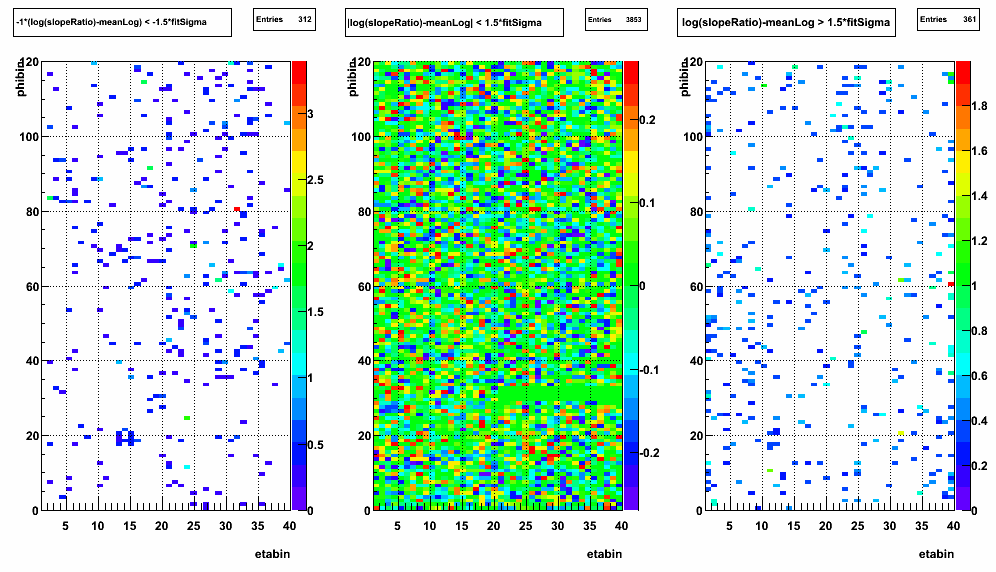
These look pretty uniform overall. The plot on the right may have more towers near |eta| ~ 1.
ETOW
Figure 7: ETOW slope ratio and error (log scale)
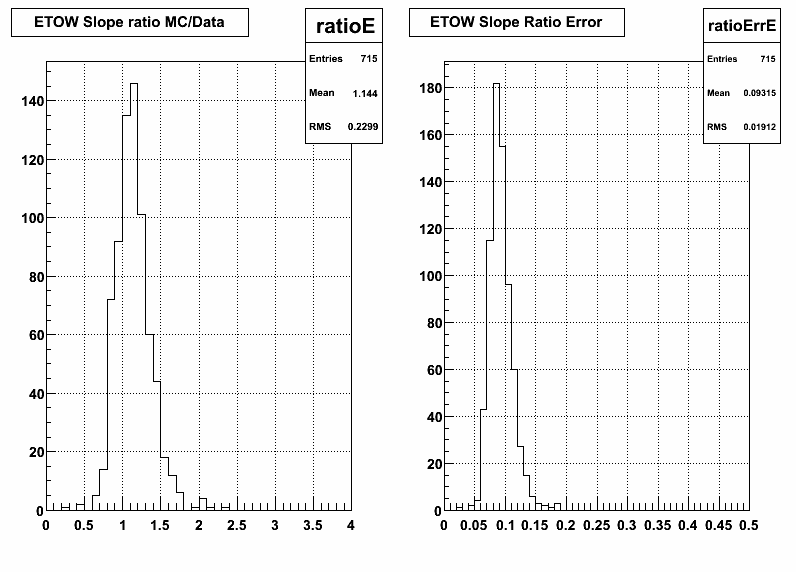
Figure 8: ETOW log(slopeRatio) fitted with gaussian
.png)
List of towers outside 3 sigma away from centroid is attached below.
| # Sigma from centroid | # towers | % of total | % expectation |
| 1 | 227 | 31.7 | 32 |
| 2 | 35 | 4.9 | 5 |
| 3 | 10 | 1.3 | 0.3 |
Similar to BTOW there are extra outliers outside 3 sigma from the centroid, but from the list of towers you can see that they are not correlated in eta-phi space. Looking at the spectra for these few outliers, they are similar to the outliers seen in the barrel, where the spectra look reasonable, but the slopes are dramatically different.
- stevens4's blog
- Login or register to post comments
