- stevens4's home page
- Posts
- 2014
- 2013
- 2012
- 2011
- December (1)
- November (2)
- October (1)
- September (1)
- August (2)
- July (3)
- June (7)
- May (2)
- April (2)
- March (5)
- February (2)
- January (2)
- 2010
- November (1)
- October (1)
- September (3)
- August (3)
- July (3)
- June (1)
- May (1)
- April (3)
- March (4)
- February (4)
- January (8)
- 2009
- December (4)
- November (3)
- October (4)
- September (5)
- August (1)
- July (2)
- June (2)
- April (1)
- March (1)
- February (2)
- January (1)
- 2008
- My blog
- Post new blog entry
- All blogs
Pre-embedding QA for W analysis II
Pre-embedding QA for W analysis II
Motivation: Verify compatibility of MC signal W events with real background events (zerobias) before embedding begins.
Things to check for TPC (just check low HV settings for now):
- dE/dx
- chi^2 / dof
Data Samples
- MC : Pythia QCD sample with partonic pT > 20 GeV. Using new TpcRS simulator in CVS. Jobs run in SL09e Nov. 19th. bfc.C(100,"MakeEvent,ITTF,NoSsdIt,NoSvtIt,Idst,VFPPVnoCTB,logger,-EventQA,-dstout,tags,Tree,EvOut,analysis,dEdxY2,IdTruth,useInTracker,-hitfilt,tpcDB,TpcHitMover,TpxClu,McAna,fzin,y2009,tpcrs,sdt20090410.060000,geant,geantout,beamLine,eemcDb,McEvOut,bigbig,emcY2,EEfs,bbcSim,ctf,CMuDST","/star/data05/scratch/balewski/TpcRS-rev2/test_QCDprod.fzd")
TimeStamp used, sdt20090410.60000, is during run R10100015. Kumac and Logfile used to generate .fzd file are attached below with ckin3=20.
- Data: SL09b production of L2W stream events from Run 9 pp500 R10100015. (This includes preliminary TPC calibration)
bfc.C(200,"DbV20090817 pp2009a ITTF BEmcChkStat QAalltrigs btofDat
Corr3 OSpaceZ2 OGridLeak3D beamLine -VFMinuit VFPPVnoCTB -
dstout","st_W_10087028_raw_4180001.daq")
Track Selection:
- Select vertices with rank > 0 and |zVertex| < 100
- Look at global component of primary tracks associated with each vertex that passed the above condition
- Require global track flag == 101, pT > 0.4 GeV and nHitsFit/nHitsPoss >= .51
For reference Jan did a similar study in June with the old TPC simulator.
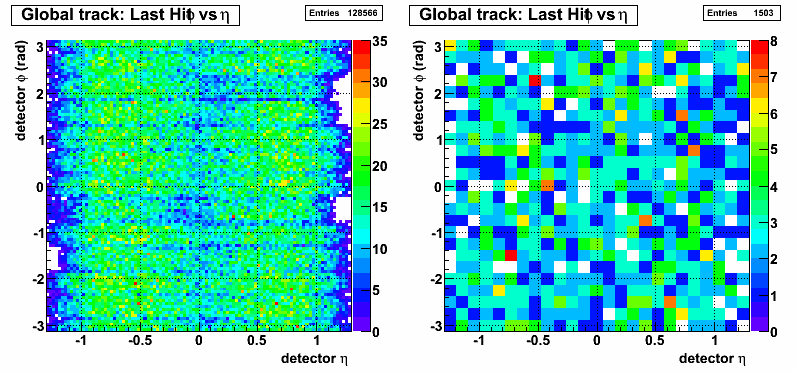
Note: For all 2D plots data is on the left and MC is on the right.
Figure 1: Chi2 / dof distribution for Data and MC
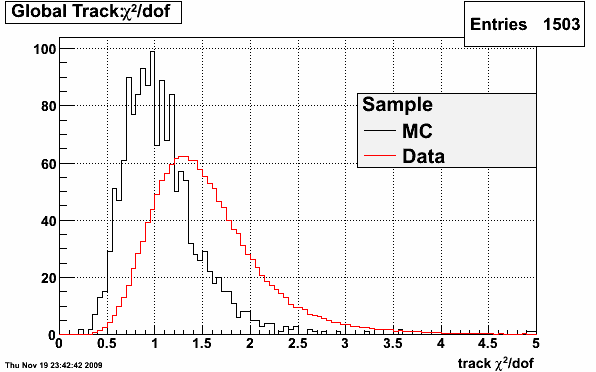
| Sample | Mean of chi2/dof distribution |
| Data | 1.552 |
| MC | 1.073 |
Figure 2: dE/dx vs p for Data (left) and MC (right)
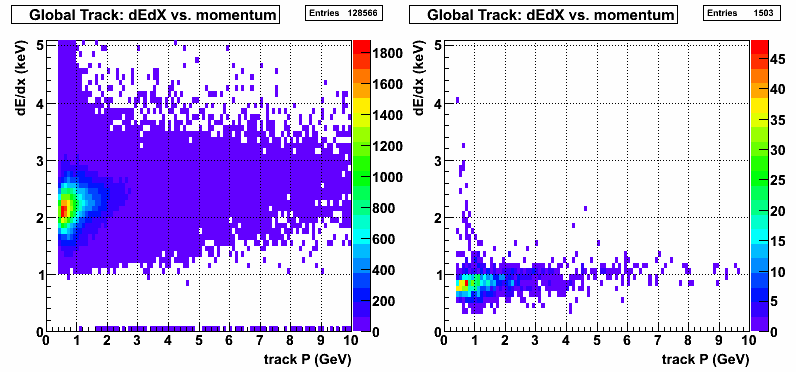
Figure 3: dE/dx for multilple pT "slices" for Data (black) and MC (red)
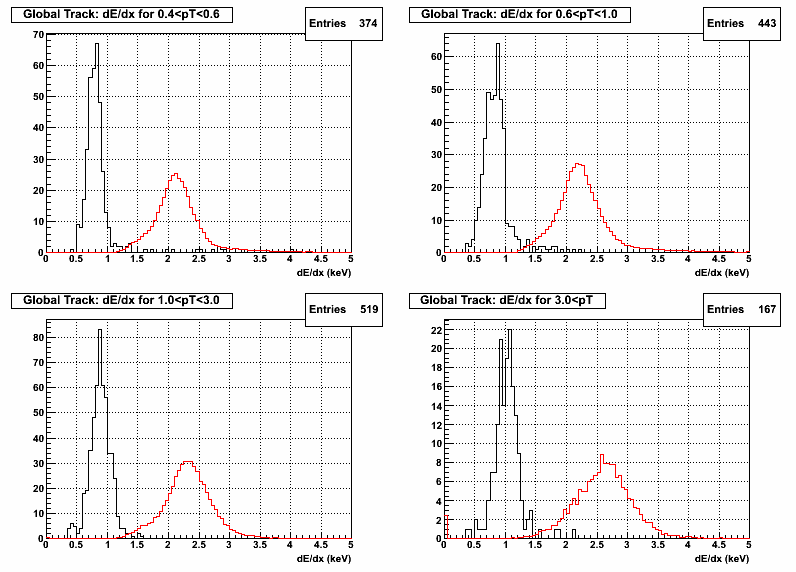
Figure 4: 1/pT vs chi2/dof for Data (left) and MC (right)
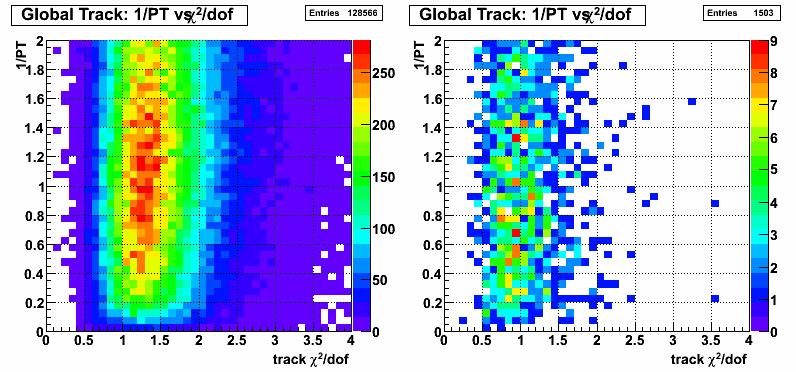
Figure 5: nHits vs chi2/dof for Data (left) and MC (right)
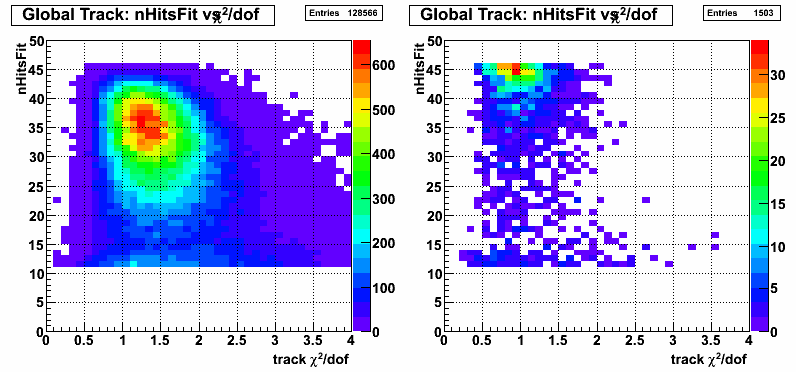
Figure 6: Last Hit on track phi vs eta for Data (left) and MC (right)
Conclusions:
- chi2/dof is ~40% larger in the data than the MC -> Clusters are better aligned in MC than Data
- dE/dx is at least factor of 2 smaller in the MC than the data
- stevens4's blog
- Login or register to post comments
