- stevens4's home page
- Posts
- 2014
- 2013
- 2012
- 2011
- December (1)
- November (2)
- October (1)
- September (1)
- August (2)
- July (3)
- June (7)
- May (2)
- April (2)
- March (5)
- February (2)
- January (2)
- 2010
- November (1)
- October (1)
- September (3)
- August (3)
- July (3)
- June (1)
- May (1)
- April (3)
- March (4)
- February (4)
- January (8)
- 2009
- December (4)
- November (3)
- October (4)
- September (5)
- August (1)
- July (2)
- June (2)
- April (1)
- March (1)
- February (2)
- January (1)
- 2008
- My blog
- Post new blog entry
- All blogs
Transverse Mass Reconstruction for W's
Transverse Mass Reconstruction for W's at STAR
So far all of our analyses have been based on looking for the Jacobian peak in the electron pT spectrum. However, there is another method of reconstructing W's using the Transvers Mass mT=sqrt(2*pT(e)*pT(neutrino)*(1-cos(phi))) where phi = angle between electron and neutrino. The neutrino transverse momentum vector is found by using pT(neutrino) = -(pT(h)+pT(electron)), where pT(h) (= -pT(W)) is the "hadronic recoil" from the W being produced. The hadronic recoil transverse momentum vector is given by the sum of all the TPC tracks transverse momentum vectors and Towers transverse momentum vectors outside the R=0.7 cone around the electron candidate. Below are some plots showing how well we can measure these quantities in MC (all the plots are filled after all the "standard" W cuts have been applied).
Update 10/20/09:
-Previously I was calculating the neutrino pT vector incorrectly, and I was not using the ETOW scale factor of 1.3 (if this is the right value?). The results below have both of these problems fixed.
-Jan suggested I look at the same plots sorted by W eta (from geant), to see if we get better results if W is headed towards or away from the Endcap. The attachments below W eta < 0 and W eta > 0 show all the figures on this page for the 2 conditions, and the results are pretty similar.
Update 10/26/09:
-Ilya suggested to not include tracks with pT < 150 MeV, so this is now included when calculating the hadronic recoil. (This doesn't change things much)
-No TPC: I did the same analysis as below, but removed the TPC, just to see what things look like. In an ideal world we wouldn't use the TPC, but we don't have hadronic calorimetry so we probably need to come up with some kind of compromise. Here is the link to the figures attached below MC and data.
W Monte-Calro
Figure 1: W pt from MC and Reco hadronic recoil pT.
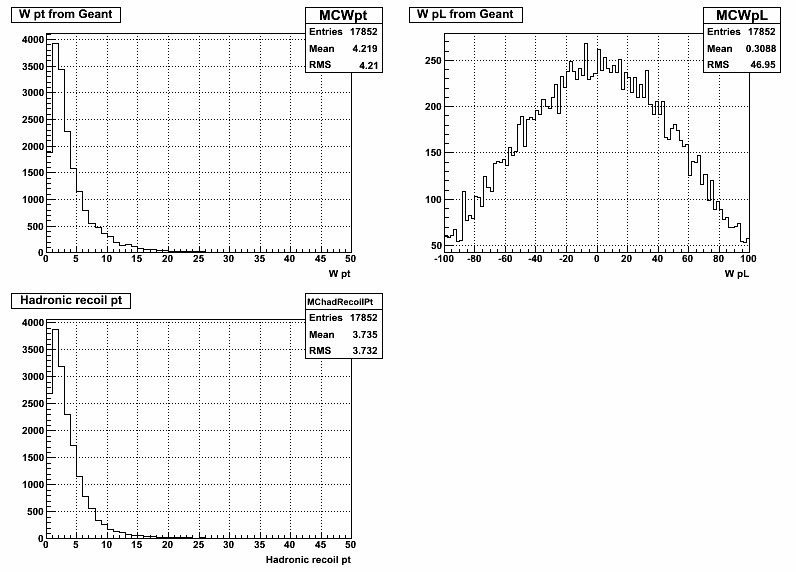
Figure 2a: Plots describing how well Hadronic Recoil is matched to W transvers momentum vector
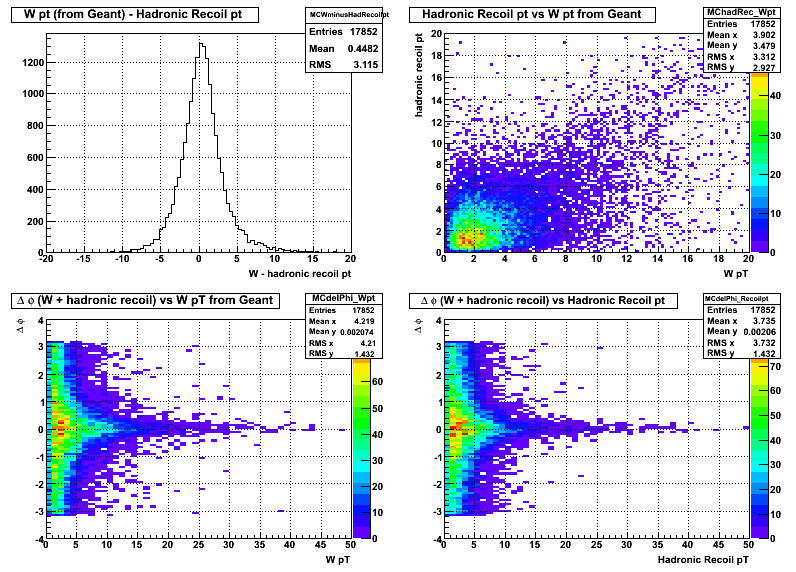
The above 2 plots show us that when the W pT is small we have a hard time getting the direction right, but at large pT, we do a much better job.
Figure 2b: Eta of hadronic recoil vector for different ranges of W eta.
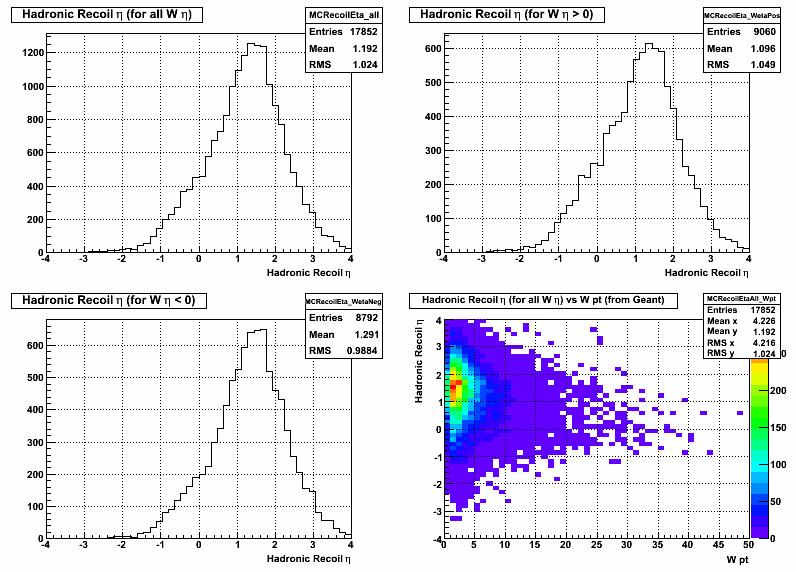
Since we know we don't reconstruct the pL of the hadronic recoil well (most of it goes down the beampipe), maybe the figure above is a little misleading. It is peaked in the Endcap region because this is where the high pL pieces of the hadronic recoil will be, but these will not necessarily have high pT. So even though the 3-vector associated with the hadronic recoil is dominated by the Endcap, the 2-vector in the transverse plane is not. You can see this by looking at the same set of figures on this page after removing the endcap from the hadronic recoil calcluation, shown here. On page 1,2 the hadronic pT distribution isn't drastically changed, and page 6 shows the eta distribution is ~uniform.
Figure 3a: Plots describing how well reconstructed electron compares with electron from geant record.
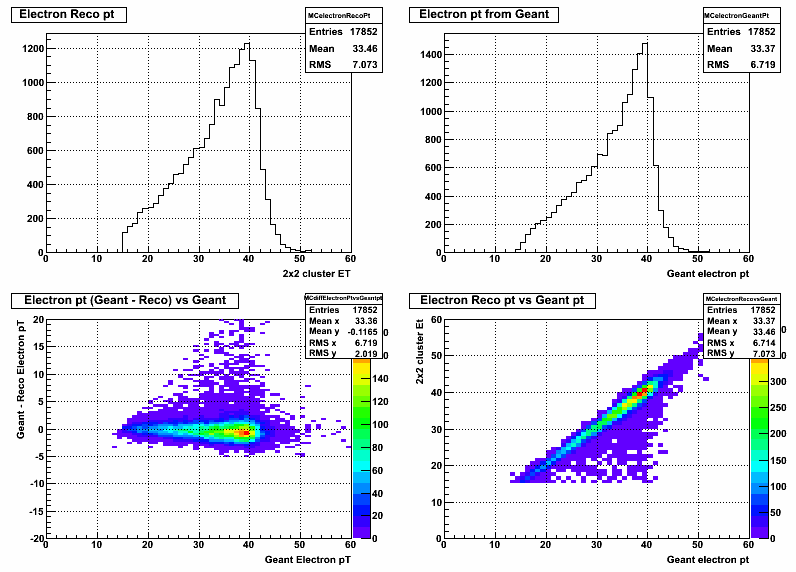
The lower left plot is in response to Jan's question, "how does difference between reco and geant depend on actual pT?" It looks like we're reconstructing the electron pT to high more often at high pT, where as at low pT the locus is centered more on zero.
Question: Could this be part of the reason why in the figure below the PYTHIA and data "peaks" don't match up?
Figure 3b: Jacobian peak for W MC (PYTHIA) and data. Difference in "peak" position could be due to reconstructing electron pT to high in MC.
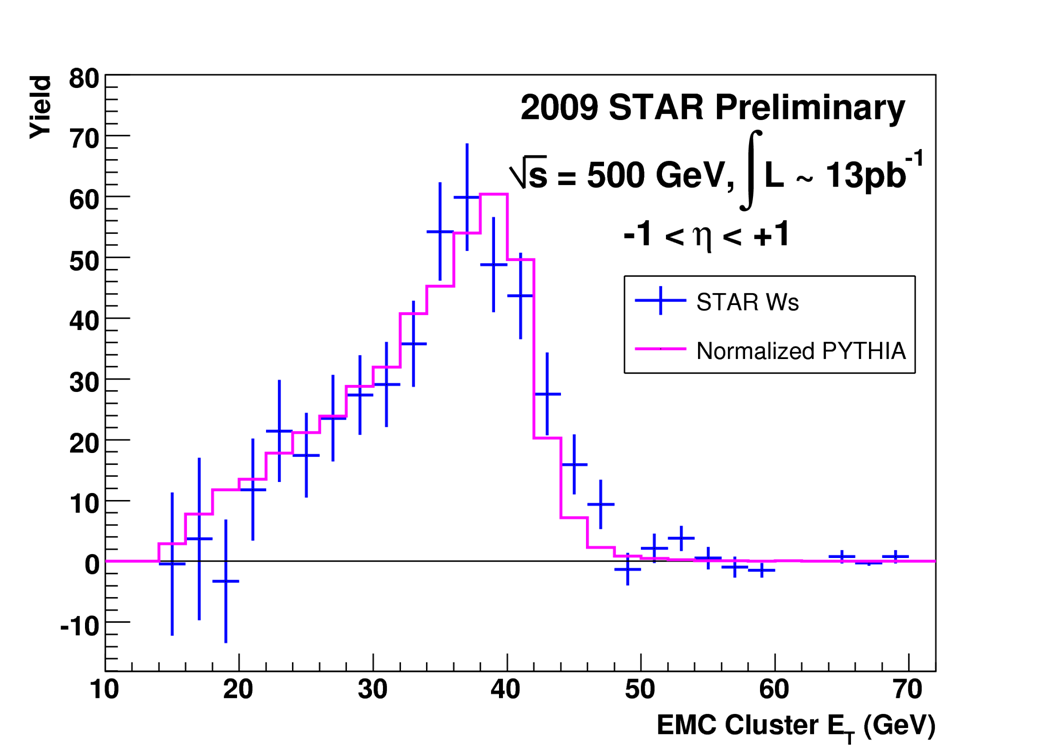
Figure 4: Plots describing how well reconstructed neutrino compares with neutrino from geant record.
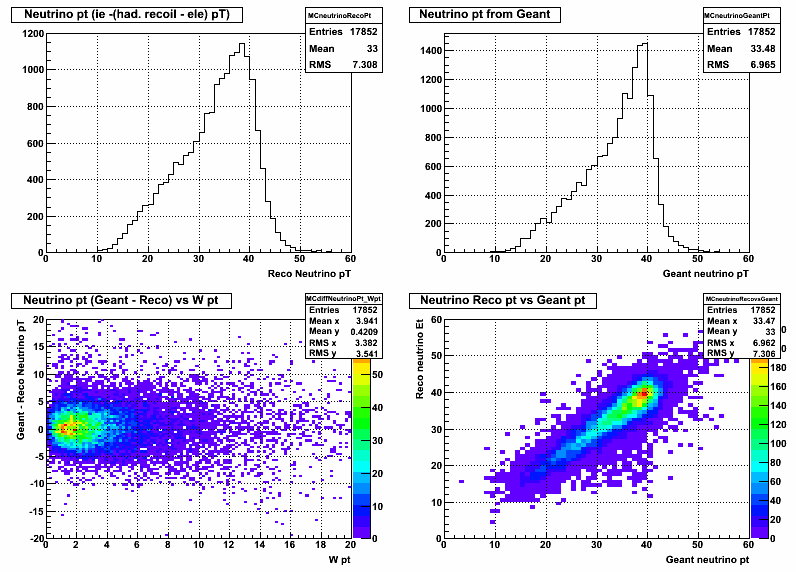
The neutrino transverse momentum vector wasn't being computed correctly previously. Now we see the agreement with Geant is much better.
Figure 5: Transverse Mass plots reconstructed and from geant record.
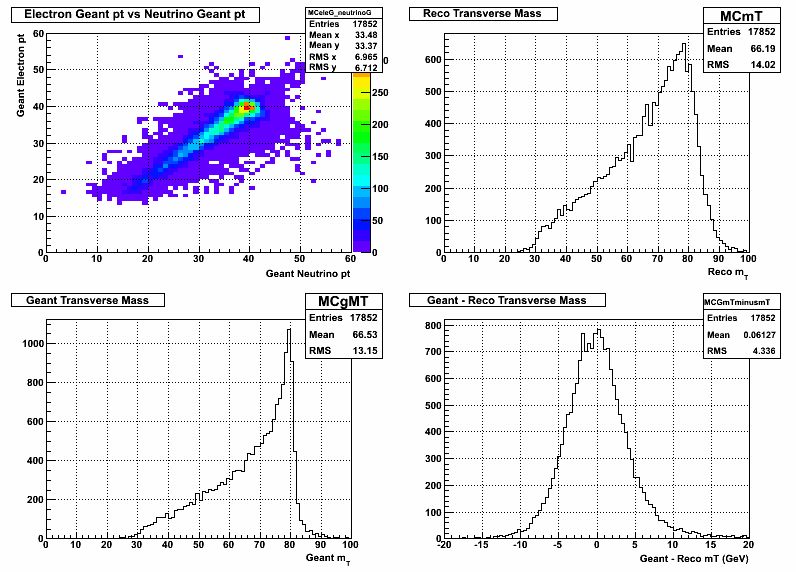
After fixing the problem with how I reconstruct the neutrino pT vector, we now see a much nicer looking mT peak in the upper right of figure 5. The upper left plot is shown to see the correlation between geant electron and neutrino pT.
Run 9 Data
The plots are filled after all the "standard" W cuts have been applied.
Figure 7: Transverse Mass Distribution for Data
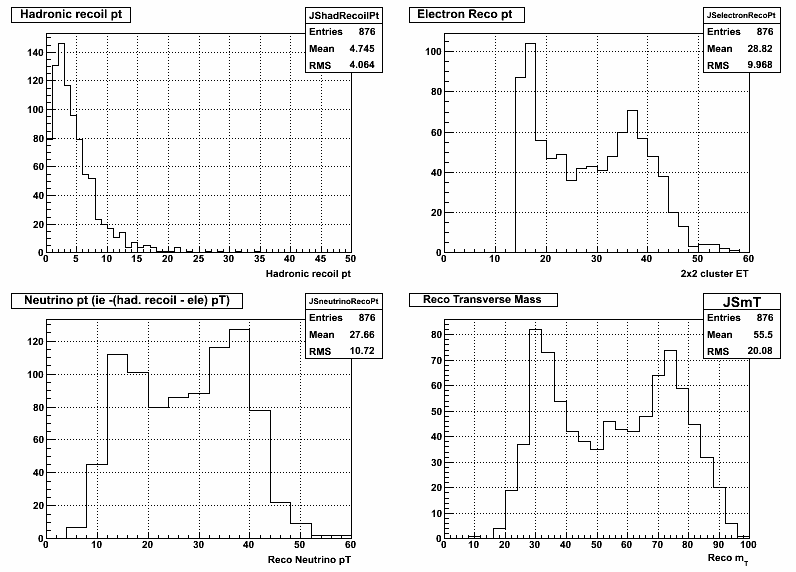
The lower right plot is a first attempt at the transverse mass distribution for the data. Doesn't look to bad for not being very hermetic.
Question: Can we do something more clever when reconstructing hadronic recoil pT? How much better can we do in reconstructing the mT?
Figure 8: Eta of hadronic recoil vector.
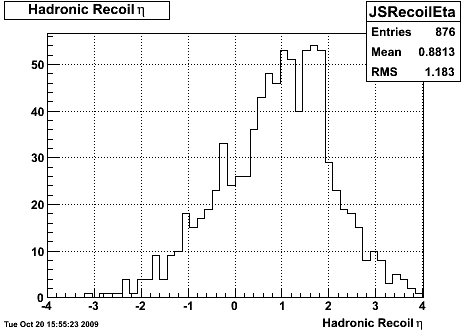
An explanation for the peak in the endcap region is given below figure 2b.
- stevens4's blog
- Login or register to post comments
