- stevens4's home page
- Posts
- 2014
- 2013
- 2012
- 2011
- December (1)
- November (2)
- October (1)
- September (1)
- August (2)
- July (3)
- June (7)
- May (2)
- April (2)
- March (5)
- February (2)
- January (2)
- 2010
- November (1)
- October (1)
- September (3)
- August (3)
- July (3)
- June (1)
- May (1)
- April (3)
- March (4)
- February (4)
- January (8)
- 2009
- December (4)
- November (3)
- October (4)
- September (5)
- August (1)
- July (2)
- June (2)
- April (1)
- March (1)
- February (2)
- January (1)
- 2008
- My blog
- Post new blog entry
- All blogs
Charge Sign Ratio for pp500 SL09b production
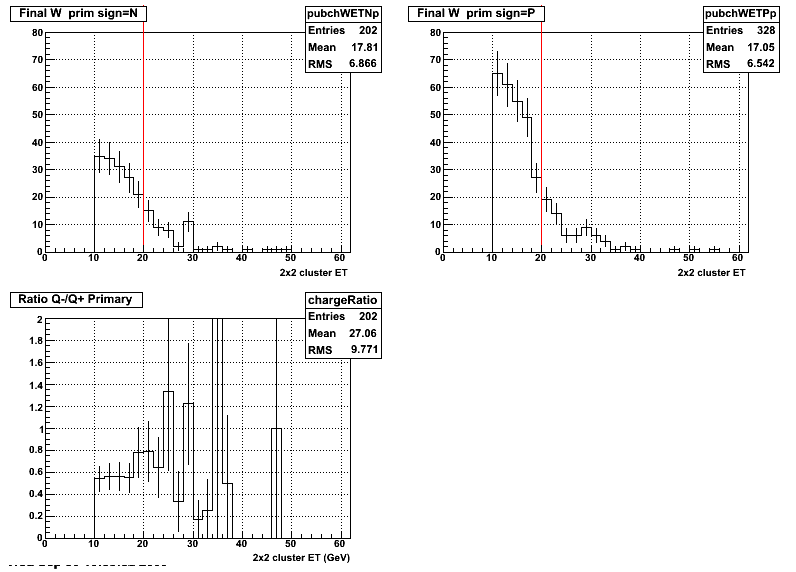
Previously Jan showed a plot (figure 10) of the charge seperated W yields. The plot titled Ratio Q-/Q+ Primary shows that in the region where we should be dominated by background (cluster ET < 20 GeV) the charge ratio is ~0.6. If we could show that this is what we expect for QCD events, this would help us argue that we can trust the charge separation at higher ET (ie. the W region). To test this we can look at the Monte Carlo QCD sample, and see what it says the charge ratio is for events that satisfy the W cuts. To get more statistics and to look at mostly QCD background in the data I loosened a couple of cuts.
Note: All the MC QCD samples shown here were generated with a filter of 20 GeV, so results with 2x2 cluster ET below this are a little suspect.
Section 1: Relax near side Jet cut
Here is the list of cuts I used for both samples in this section (changes from Jan's verB4.3 are in bold)
TPC: nPileupVert>3, vertex |Z|<100.0cm, globEleTrack: nFit>15, hitFrac>0.51 Rin<90.0cm, Rout>170.0cm, PT>10.0GeV/c
BTOW ADC: kSigPed=3 AdcThr>8 maxAdc>200 clustET>10.0 GeV ET2x2/ET4x4>0.95 ET2x2/nearTotET>0.0
dist(track-clust)<7.0cm, nearDelR<0.7
Counters Thresholds: track>1.0 GeV, tower>1.0 GeV Use ETOW: flag=2
W selection highET>28.0 awayDelPhi<0.7rad awayTotET>8.0GeV
Basically 3 things changed:
Lower the 2x2 Cluster ET threshold to 10 GeV
Turn off the Near Jet Veto
Require 8 GeV of energy on the away side
Figure 1: Charge sign sorted yields and charge ratio for QCD enhanced Data sample
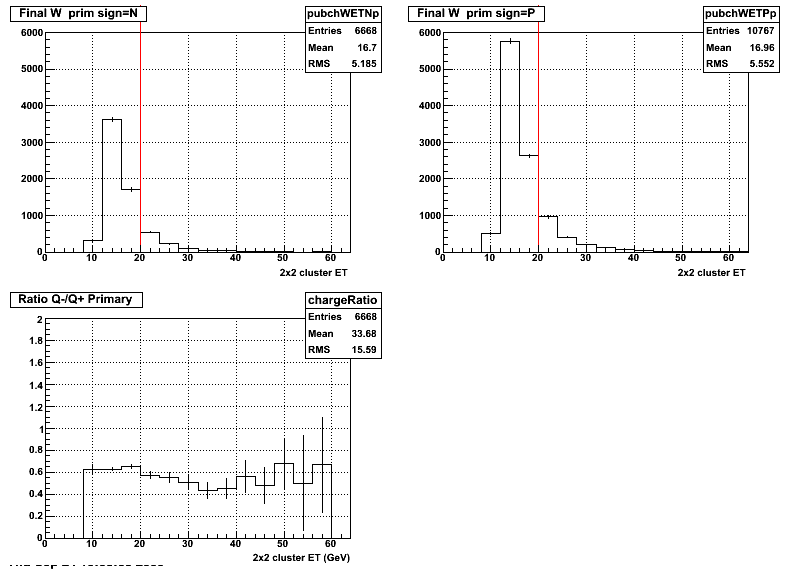
It's nice to see that the charge ratio for this sample looks very similar to what we saw below ET=20 in Jan's plot.
Figure 2: Charge sign sorted yields and charge ratio for MC QCD sample
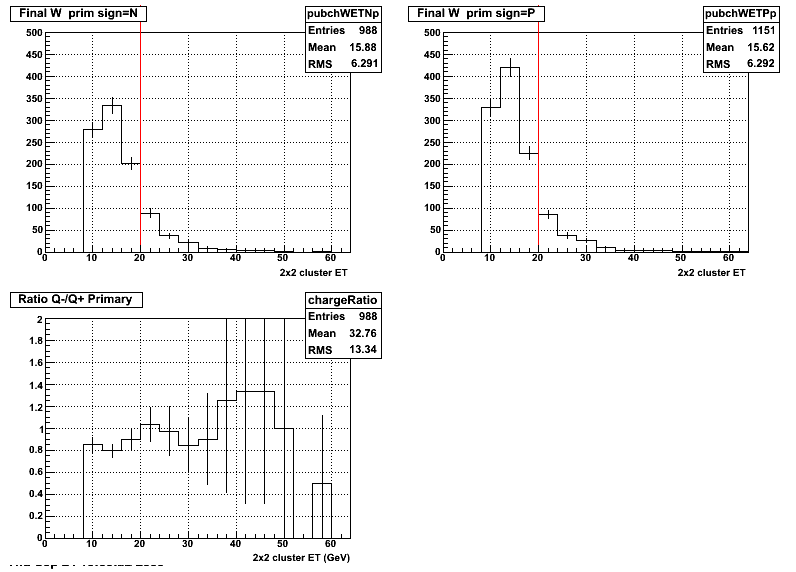
Conclusion: It looks like the charge ratio goes in the right direction in the MC, but isn't as small as we would expect from looking at the data. However, the above plots were made with the 2x2/nearJet veto turned off. Next, in Section 2, I look at a different set of cuts where the near Jet veto is applied to enhance events with high z leading particles carrying most of the quark's energy.
Section 2: Apply near side Jet cut again (change cone radius)
Here is the list of cuts I used for both samples (changes from Jan's verB4.3 are in bold)
TPC: nPileupVert>3, vertex |Z|<100.0cm, globEleTrack: nFit>15, hitFrac>0.51 Rin<90.0cm, Rout>170.0cm, PT>10.0GeV/c
BTOW ADC: kSigPed=3 AdcThr>8 maxAdc>200 clustET>10.0 GeV ET2x2/ET4x4>0.9 ET2x2/nearTotET>0.88
dist(track-clust)<7.0cm, nearDelR<0.5
Counters Thresholds: track>1.0 GeV, tower>1.0 GeV Use ETOW: flag=2
W selection highET>28.0 awayDelPhi<0.7rad awayTotET>8.0GeV
Figure 3: Charge sign sorted yields and charge ratio for MC QCD sample
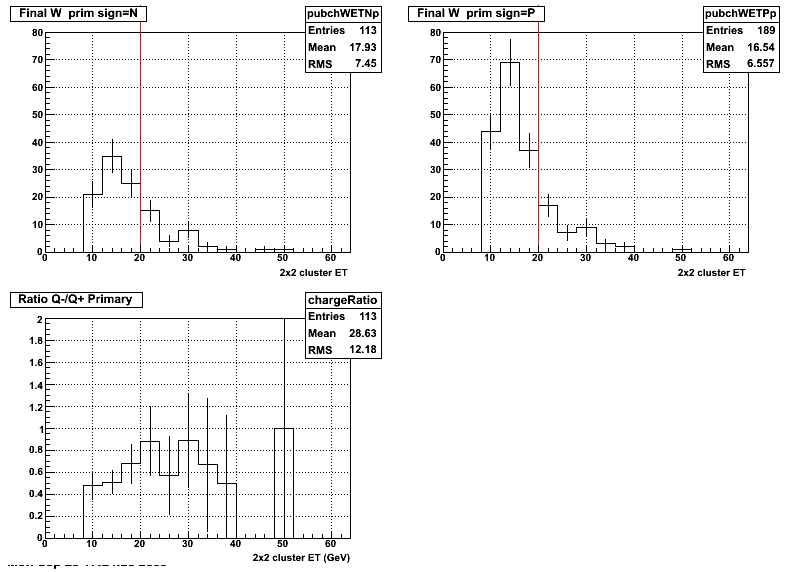
Conclusion: The added requirement of satisfying the near side jet cut has dropped our stastics a lot so the error bars are huge, but it looks like by basically requiring that the event pass our W-algo cuts on the near side has moved the ratio in the "right direction." In Section 3 below I loosen some cuts to get more statistics, but try to keep requirements for a high z leading particle on the near side pretty tight.
Section 3: Lossen near side cuts (just a little)
Here is the list of cuts I used for this section (changes from Jan's verB4.3 are in bold)
TPC: nPileupVert>3, vertex |Z|<100.0cm, globEleTrack: nFit>15, hitFrac>0.51 Rin<90.0cm, Rout>170.0cm, PT>10.0GeV/c
BTOW ADC: kSigPed=3 AdcThr>8 maxAdc>200 clustET>10.0 GeV ET2x2/ET4x4>0.85 ET2x2/nearTotET>0.85
dist(track-clust)<9.0cm, nearDelR<0.5
Counters Thresholds: track>1.0 GeV, tower>1.0 GeV Use ETOW: flag=2
W selection highET>28.0 awayDelPhi<0.7rad awayTotET>8.0GeV
Figure 4: Charge sign sorted yields and charge ratio for MC QCD sample
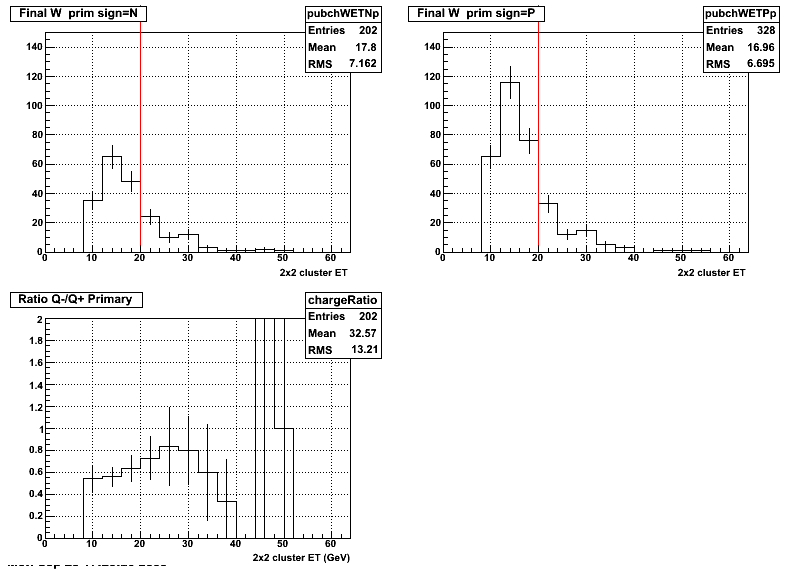
Comments on W phone 9/30/09: Why do shapes look so similar for + and - charges? Maybe counting both jets from di-jet event?
Update: After running over the sample again I found that there are no events where 2 tracks are found that satisfy all the cuts. In other words there is no "double counting" going on. I think to understand the similarity in the shape it should be noted that figure 4 has bin widths are 4 GeV. This should be significantly smoother than the original spectra where bins are 1 GeV wide. Below figure 5 is the same histogram as figure 4, but has bin widths set to 2 GeV. Does it look ratty enough?
Figure 5: Same as Figure 4, but with bin widths = 2 GeV instead of 4 GeV.
Conclusion: Because the statistics are lousy it's still hard to conclude much from this other than the MC tells us that Q-/Q+ should be less than 1 for high z leading particles, but I'm not sure we can quantify what the value of the charge ratio should be with this MC QCD data set.
- stevens4's blog
- Login or register to post comments
