- stevens4's home page
- Posts
- 2014
- 2013
- 2012
- 2011
- December (1)
- November (2)
- October (1)
- September (1)
- August (2)
- July (3)
- June (7)
- May (2)
- April (2)
- March (5)
- February (2)
- January (2)
- 2010
- November (1)
- October (1)
- September (3)
- August (3)
- July (3)
- June (1)
- May (1)
- April (3)
- March (4)
- February (4)
- January (8)
- 2009
- December (4)
- November (3)
- October (4)
- September (5)
- August (1)
- July (2)
- June (2)
- April (1)
- March (1)
- February (2)
- January (1)
- 2008
- My blog
- Post new blog entry
- All blogs
Pre-embedding TpcRS QA for W analysis III
Pre-embedding TpcRS QA for W analysis III
Motivation: Verify compatibility of MC signal W events with real background events (zerobias) before embedding begins.
Things to check for TPC response (just check low HV setting for now):
- dE/dx
- chi^2 / dof
- TPC dead regions (padrows)
- # of points used in track fits
Data Samples:
- MC : Pythia QCD sample with partonic pT > 15 GeV. 2.5K events generated. Current TpcRS simulator in CVS used. Jobs run in dev April 5th. TimeStamp used, sdt20090412, is during run R10101078. The Kumac used to generate the .fzd file is attached below.
- Uncorrected Sample (i.e. "Corr4,OSpaceZ2,OGrigLeak3D" are not applied in the bfc for this sample) bfc.C(500,"MakeEvent,ITTF,NoSsdIt,NoSvtIt,Idst,VFPPVnoCTB,logger,-EventQA,-dstout,tags,Tree,EvOut,
analysis,dEdxY2,IdTruth,useInTracker,-hitfilt,tpcDB,TpcHitMover,TpxClu,McAna,fzin,y2009a,tpcrs,sdt20090412,geant,geantout,
beamLine,eemcDb,McEvOut,bigbig,emcY2,EEfs,bbcSim,ctf,CMuDST","/star/data05/scratch/stevens4/wAnalysisOut/tpcRStest/data/fzd/sample7Pt15.fzd")
- Corrected Sample (i.e. "Corr4,OSpaceZ2,OGrigLeak3D" are applied in the bfc for thissample) bfc.C(500,"MakeEvent,ITTF,NoSsdIt,NoSvtIt,Idst,VFPPVnoCTB,logger,-EventQA,-dstout,tags,Tree,EvOut,analysis,dEdxY2,Corr4,
OSpaceZ2,OGridLeak3D,IdTruth,useInTracker,-hitfilt,tpcDB,TpcHitMover,TpxClu,McAna,fzin,y2009a,tpcrs,sdt20090412,geant,geantout,
beamLine,eemcDb,McEvOut,bigbig,emcY2,EEfs,bbcSim,ctf,CMuDST","/star/data05/scratch/stevens4/wAnalysisOut/tpcRStest/data/fzd/sample7Pt15.fzd")
- Uncorrected Sample (i.e. "Corr4,OSpaceZ2,OGrigLeak3D" are not applied in the bfc for this sample) bfc.C(500,"MakeEvent,ITTF,NoSsdIt,NoSvtIt,Idst,VFPPVnoCTB,logger,-EventQA,-dstout,tags,Tree,EvOut,
- Data Sample: SL09g production of L2W stream events from Run 9 pp500 R10101078.
Track Selection:
- Select vertices with rank > 0 and |zVertex| < 100
- Look at global component of primary tracks associated with each vertex that passed the above condition
- Require global track flag == 101, pT > 1 GeV, nHits > 15, and nHitsFit/nHitsPoss >= .51
Here is a link to a previous study before some recent changes to TpcRS
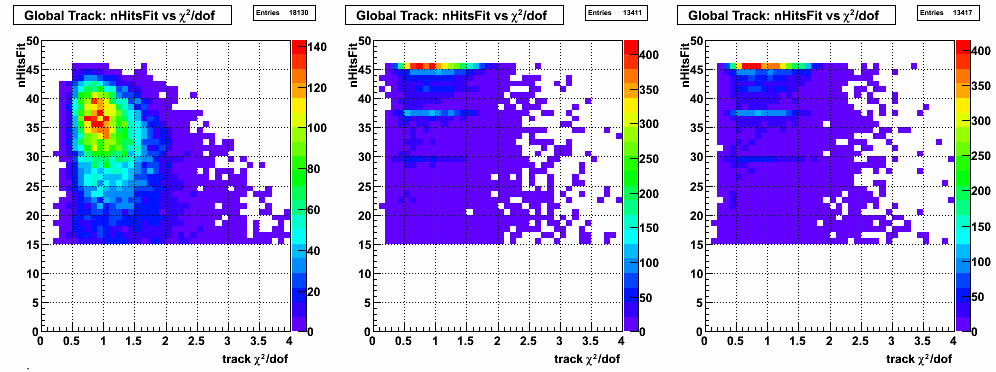
Note: For all figures with 2D plots data is on the left, uncorrected MC is in the middle, and corrected MC is on the right.
Figure 1: nHitsFit for Data and MC
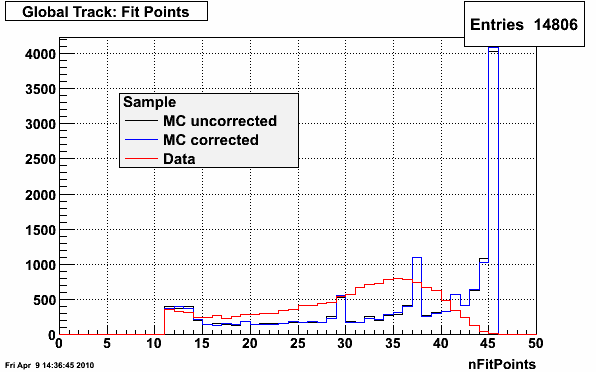
Figure 2: nHitsFit/nHitsPoss for Data and MC
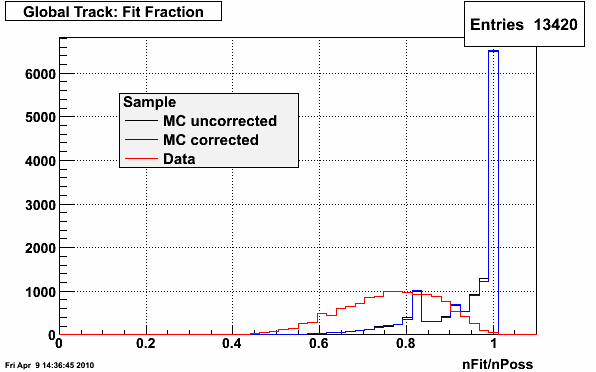
The MC seems to be doing "to good" a job of associating points with tracks, as most of the tracks use all the possible points.
Figure 3: detector phi vs nHitsFit for Data (left), Uncorrected MC (middle), and corrected MC (right). This plot is for the East half of the TPC or track <z> < 0.
.png)
Figure 4: detector phi vs nHitsFit for Data (left), Uncorrected MC (middle), and corrected MC (right). This plot is for the West half of the TPC or track <z> > 0.
.png)
The phi bins (on the y axis of figures 3 and 4) are TPC sectors, and there are regions where you can see the obvious effect of dead padrows in both the Data and MC reflected in the number of hits fit. Below in figure 5 and 6 you can see the distribution of hit padrows for each sample, and the dead padrows can clearly be seen there as well. However, there are a few places where the data and MC dead regions don't agree, which Gene is investigating and is probably a DB issue.
Figure 5: detector phi vs padrow for Data (left), Uncorrected MC (middle), and corrected MC (right). This plot is for the East half of the TPC or track <z> < 0.
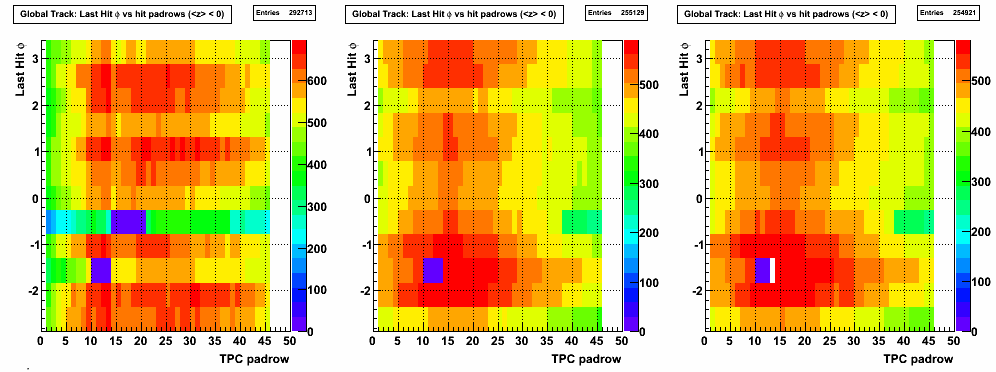
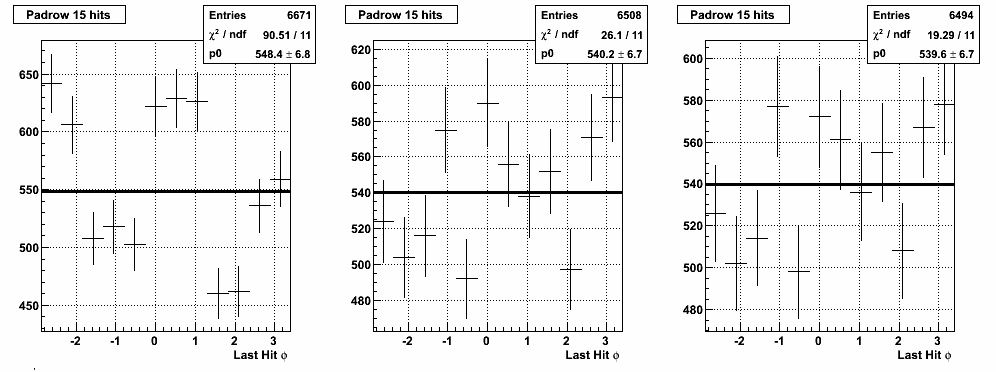
Figure 5b: Hits on padrow 15 (<z> < 0) for Data (left), Uncorrected MC (middle), and corrected MC (right). Note: Sector 20 @ phi=-0.5 is removed from the data plot
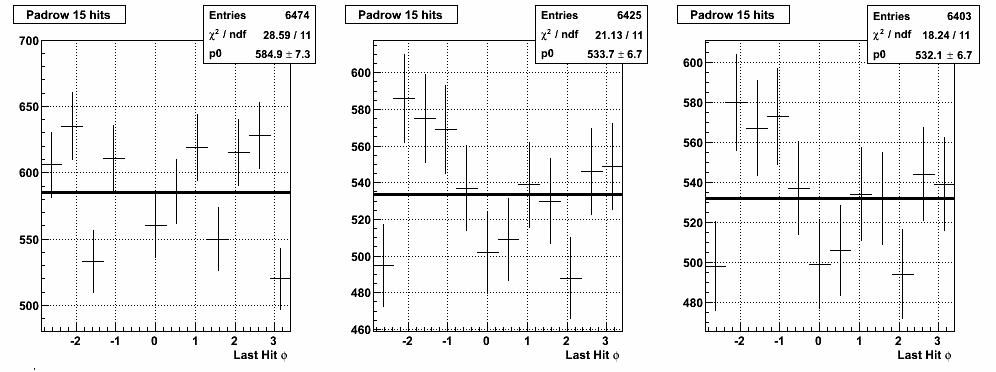
Figure 6: detector phi vs padrow for Data (left), Uncorrected MC (middle), and corrected MC (right). This plot is for the West half of the TPC or track <z> > 0.
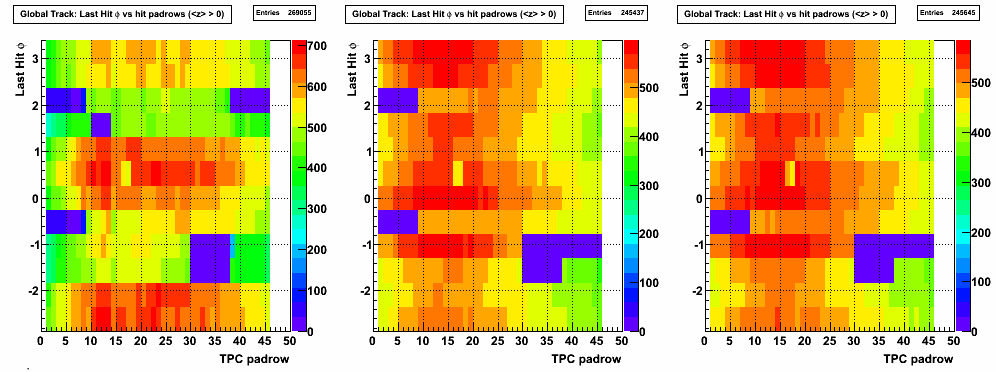
Figure 6b: Hits on padrow 15 (<z> > 0) for Data (left), Uncorrected MC (middle), and corrected MC (right).
In figures 5 and 6 there appears to be an ineffiency in the inner padrows in the data that is not seen in the MC. It is possible that this is the radial effect that is expected from the deconvoluted clusters. Below in figure 7 there is a similar distribution to figure 1, but now excluding the first 10 padrows so the maximum number of hit padrows is 35. There is still considerable disagreement, so it appears the adial efficiency effect does not explain this difference in hit points.
Figure 7: Number of padrows hit with rowID>10 for Data and MC
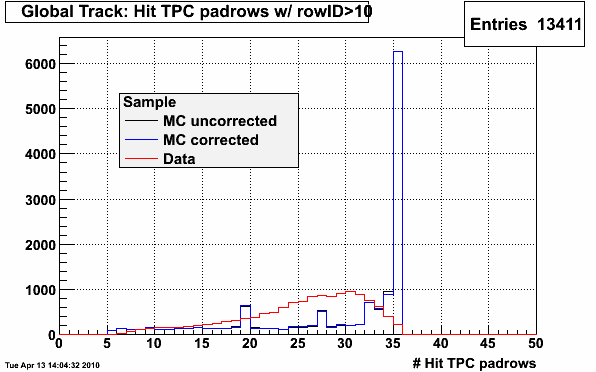
Figure 8: Last Hit on track phi vs eta for Data (left), Uncorrected MC (middle), and corrected MC (right).
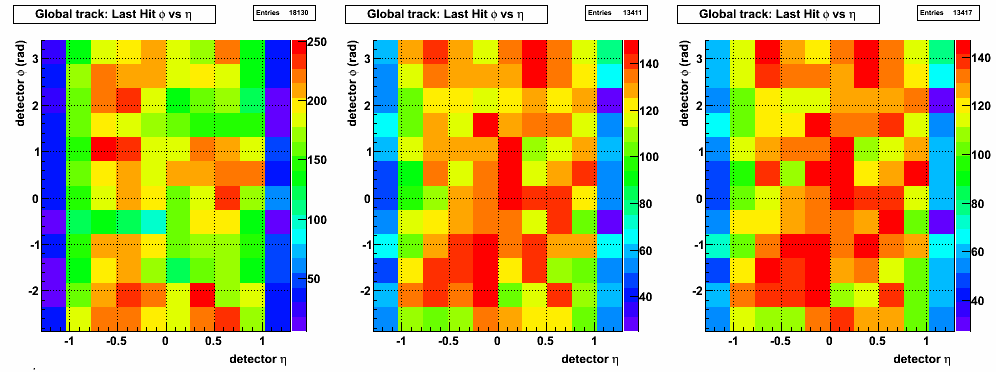
In figure 3, 4, 5, and 6 we saw that for certain sectors the effects of the dead padrows are evident in the MC. However, in figure 8 we see that this doesn't seem to lead to a lower yield in those sectors for the MC as we see for the data. Thus, the MC is more efficient in those sectors than in the data.
Figure 9: Chi2 / dof distribution for Data and MC
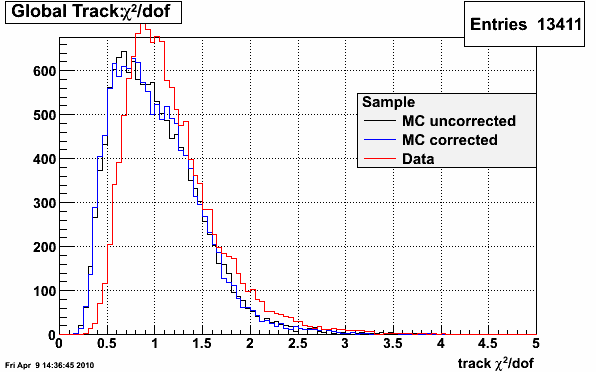
Table 1: Chi^2/DOF mean and RMS for both Data and MC
| Sample | Chi2 Mean | Chi2 RMS |
| Uncorrected MC | 1.02497 | 0.472856 |
| Corrected MC | 1.02022 | 0.46529 |
| Data | 1.17669 | 0.48738 |
The Chi^2 distributions look reasonable, and with data mean still ~15% larger than the MC mean.
Figure 10: dE/dx vs p for Data (left), Uncorrected MC (middle), and corrected MC (right).
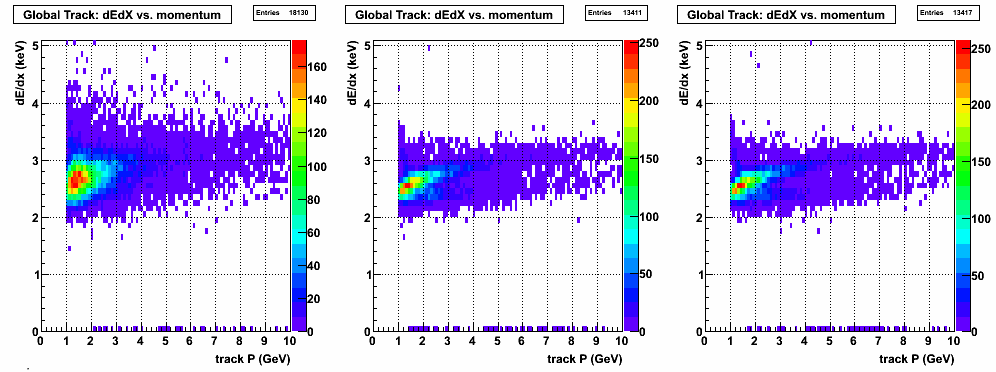
Figure 11: dE/dx for two pT "slices" for Data (red), Uncorrected MC (blue), and Corrected MC (black).
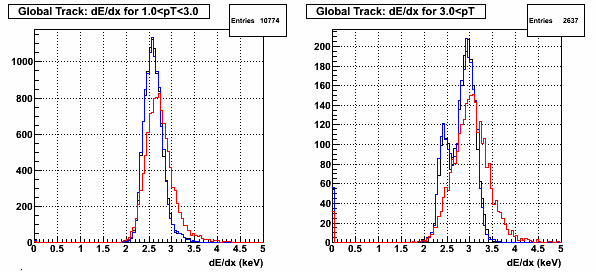
The dE/dx distributions have improved significantly with Yuri's tuning.
Figure 12: 1/pT vs chi2/dof for Data (left), Uncorrected MC (middle), and corrected MC (right).
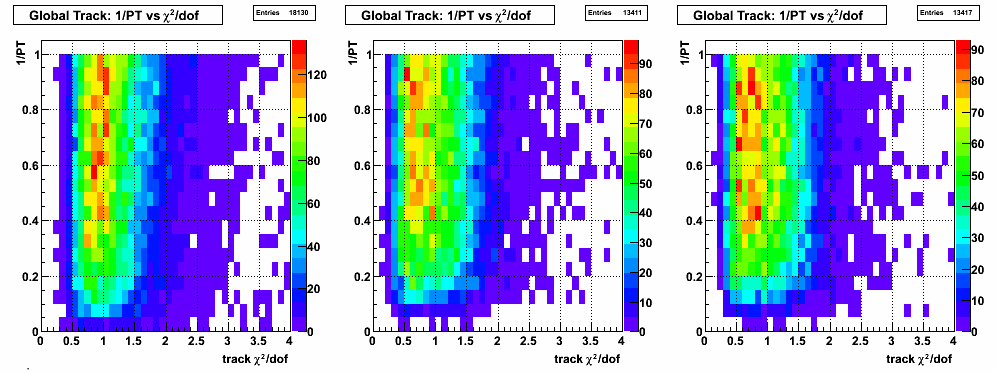
Figure 13: nHitsFit vs chi2/dof for Data (left), Uncorrected MC (middle), and corrected MC (right).
Groups:
- stevens4's blog
- Login or register to post comments