- stevens4's home page
- Posts
- 2014
- 2013
- 2012
- 2011
- December (1)
- November (2)
- October (1)
- September (1)
- August (2)
- July (3)
- June (7)
- May (2)
- April (2)
- March (5)
- February (2)
- January (2)
- 2010
- November (1)
- October (1)
- September (3)
- August (3)
- July (3)
- June (1)
- May (1)
- April (3)
- March (4)
- February (4)
- January (8)
- 2009
- December (4)
- November (3)
- October (4)
- September (5)
- August (1)
- July (2)
- June (2)
- April (1)
- March (1)
- February (2)
- January (1)
- 2008
- My blog
- Post new blog entry
- All blogs
Understanding Track <z> Distribution
Understanding Track <z> Distribution
Data: L2W stream Data and ZeroBias Data from Fill 10531 (Run numbers 10101059-10101094)
Motivation: Understand pile-up effects from Zero Bias data and compare with distributions in L2W data
Track Selection: Global: pt > 1, nHitsFit >= 15, and nHitsFit/nHitsPos >= 0.51
Primary: same as global above except must come from vertex with rank > 0 and |z| < 100 cm
Figure 0: Global component of primary tracks <z> distribution for L2W data
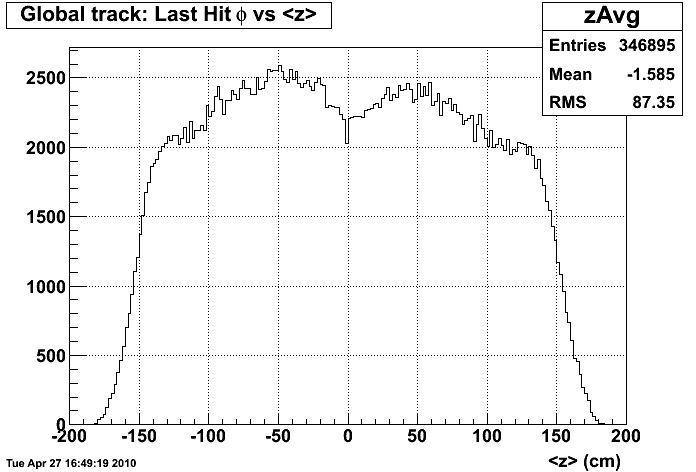
The figure above is a reminder of the lower yield of TPC tracks at |<z>| < 25 seen in the data.
Figure 1: Track <z> distribution for multiple datasets ( L2W global=black, ZB global=red, L2W global - ZB global=blue, and L2W global component of primary=magneta )
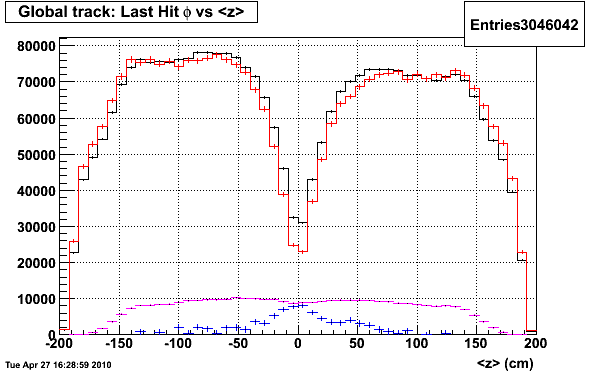
The ZB data in the plot above is scaled by the relative number of L2W/ZB events in each run so the 2 distributions can be compared quantitatively. The same image is shown here with zoomed in on the y-axis [0,12k].
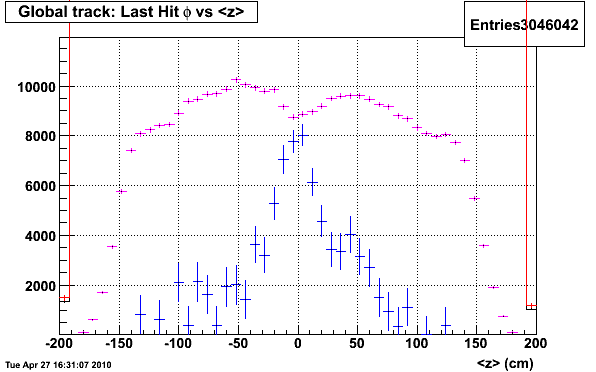
Comments:
1) The pile-up track distribution (ZB data) has a very strong z dependence (I hadn't fully appreciated this, but probably should have). The ZB data is also a significant fraction of the total global tracks, even near |<z>|=0.
2) The difference between the L2W global spectrum and scaled ZB spectrum is shown in the blue curve, and is relatively flat at |<z>|=0. This could indicate that a 'pile-up free' data set would not have a lower yield near |<z>|=0.
3) The magenta curve is the global components of the priary tracks in the L2W sample (same as figure 0), and has a lower yield near |<z>|=0. This could indicate that the lower yield is not a TPC tracking inefficiency (as we assumed previously), but instead it is the result of a smaller amount of pile-up in the primary track sample.
Figure 2: Global Track <z> distribution for 2 runs of ZB data (R10101060=black and R10101094=red)
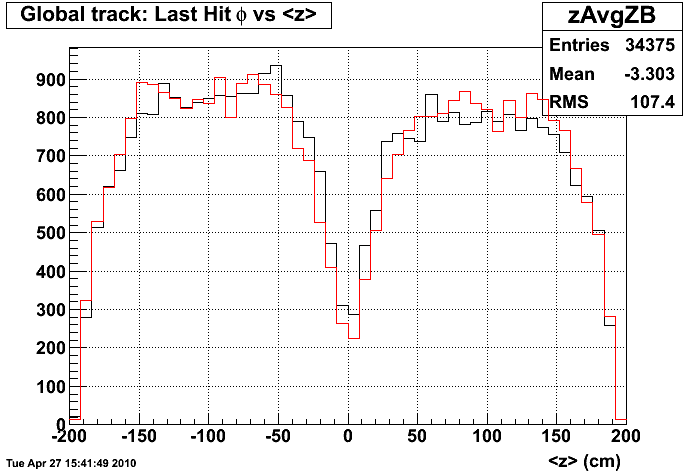
The 2 runs shown in figure 2 were at the beginning and end of the fill so they had rather different ZDC coincidence rates (R10101060=163kHz and R10101094=105kHz). The 2 curves are normalized by the integral.
Comments:
1) The 'plateau' in the ZB tracks seems to move away from the CM as the ZDC coincidence rate decreases. My (maybe naive) picture is the rate and the drift velocity gives a rough idea of where the 'plateau' should be. So, to estimate the effects of pile-up in embedding we should be sure to sample the ZDC coincidence rate correctly to see the same |<z>| dependence.
Groups:
- stevens4's blog
- Login or register to post comments