- stevens4's home page
- Posts
- 2014
- 2013
- 2012
- 2011
- December (1)
- November (2)
- October (1)
- September (1)
- August (2)
- July (3)
- June (7)
- May (2)
- April (2)
- March (5)
- February (2)
- January (2)
- 2010
- November (1)
- October (1)
- September (3)
- August (3)
- July (3)
- June (1)
- May (1)
- April (3)
- March (4)
- February (4)
- January (8)
- 2009
- December (4)
- November (3)
- October (4)
- September (5)
- August (1)
- July (2)
- June (2)
- April (1)
- March (1)
- February (2)
- January (1)
- 2008
- My blog
- Post new blog entry
- All blogs
Using Run 9 W candidates to evaluate BTOW calibration
Using Run 9 W candidates to evaluate BTOW calibration
Recently Helen Caines did a study of the TPC momentum resolution for high pT tracks from the W sample by assuming the the calorimeter resolution is very good at high ET. A similar procedure could be used to evaluate the BTOW absolute scale by assuming that on average the TPC measures the momentum correctly and thus the peak of the E/p distribution should be centered at 1 if the BTOW absolute scale is correct. Below are some distributions to (hopefully) start some discussion on how well this kind of procedure could do in confirming the BTOW calibration at high ET.
Note: The plots below use the BTOW calibration from Matt using pp200 data (link).
Section 1: Distributions for events passing all W algo cuts (ie. W signal events)
Figure 1: 2x2 Cluster E vs primary track p for positive charges (left) and negative charges (right). The curve is just a line drawn at y=x.
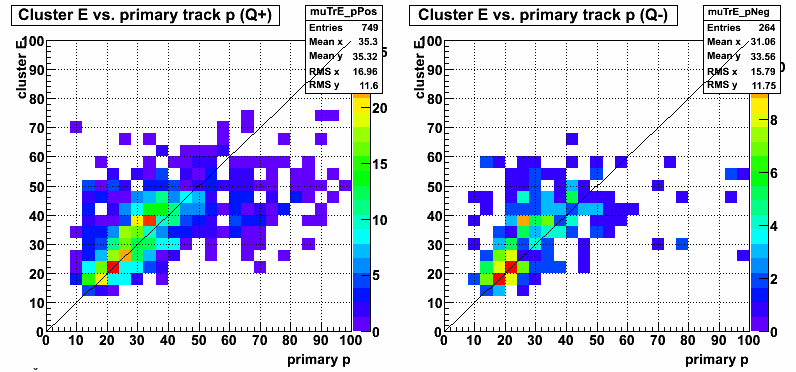
Figure 2: Primary track Q/p vs 2x2 Cluster E. The curves are just lines drawn at y=1/x and y=-1/x .
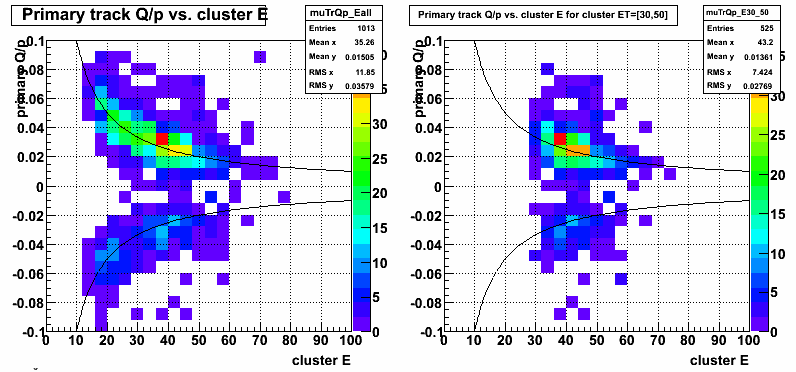
Figure 3: E/p vs 2x2 cluster ET for positive charges (left) and negative charges (right). The bottom 2 plots are the centroid of gaussian fits for the 2x2 cluster ET bins (the individual fits are shown in Fig 4 and 5).
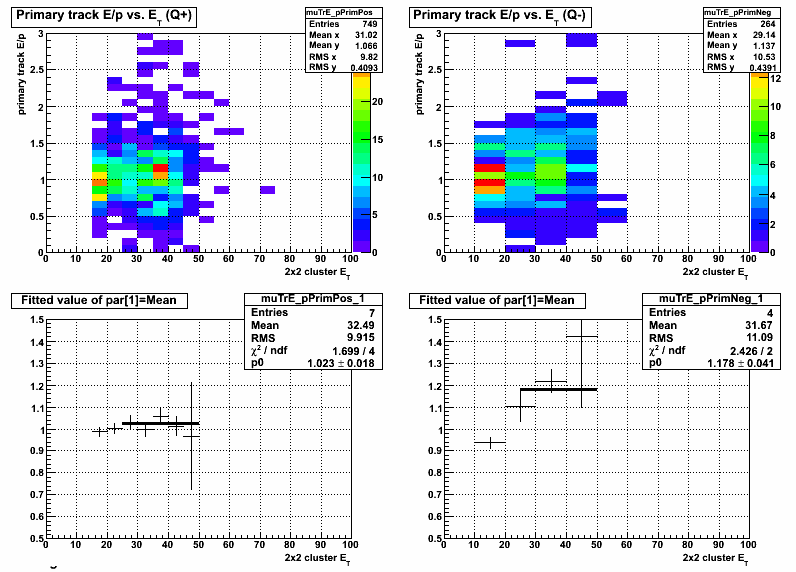
Figure 4: E/p for postive charges in slices of 2x2 cluster ET fit with a Gaussian in the range [0,2]
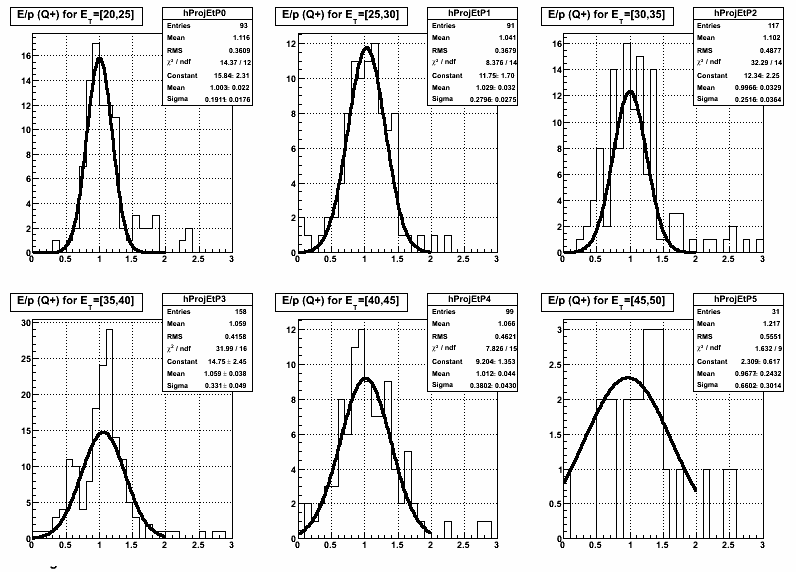
Figure 5: E/p for negative charges in slices of 2x2 cluster ET fit with a Gaussian in the range [0,2]
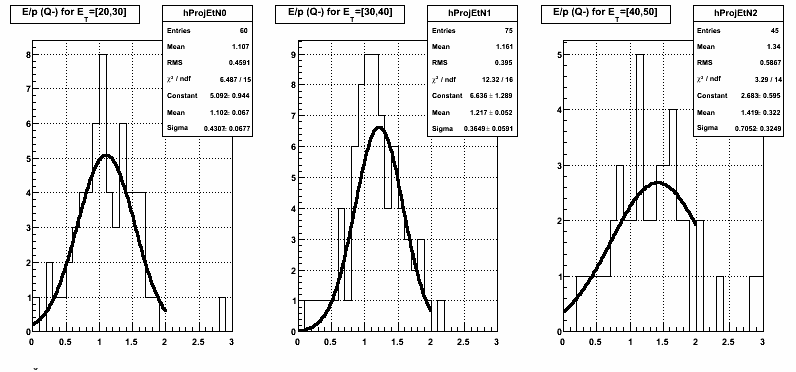
Figure 6: E/p vs detector eta for postively charged candidates with ET > 30 GeV
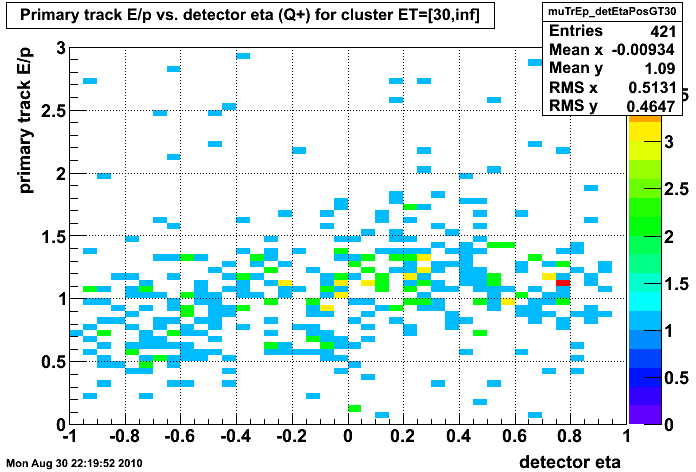
Figure 7: E/p for positively charged candidates with ET > 30 GeV (4 different detector eta bins)
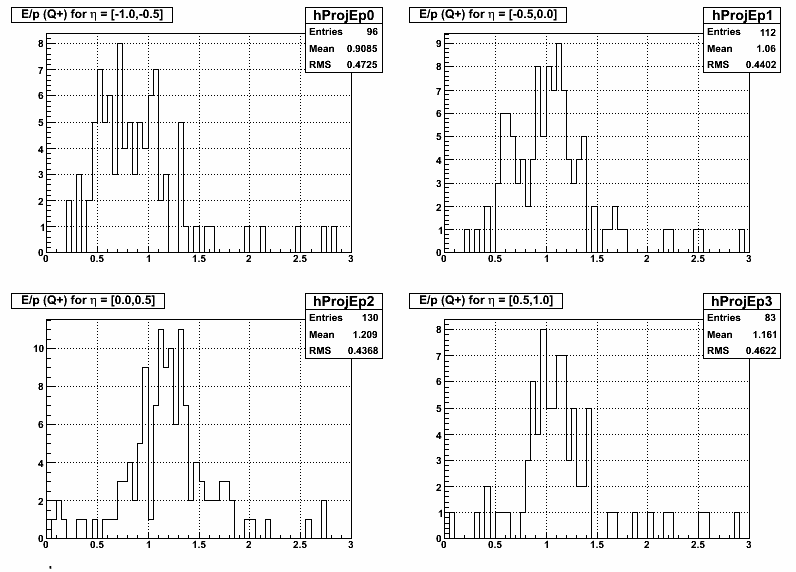
Figure 8: 2x2 Cluster ET for positively charged candidates (4 different detector eta bins)
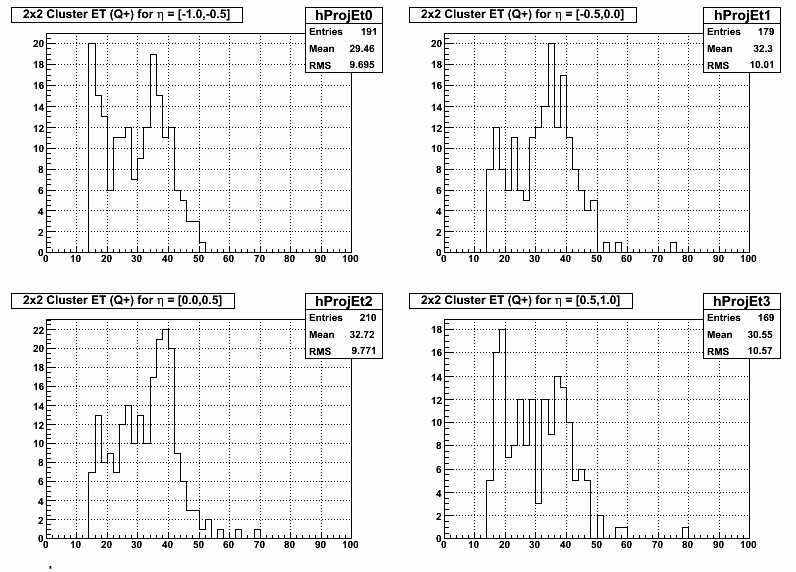
For 2x2 Cluster ET=[30,50] here is the mean and error on the mean for each eta bin:
eta=[-1.0,-0.5] mean ET =37.7421 mean_err=0.337876
eta=[-0.5,0.0] mean ET =37.9954 mean_err=0.365974
eta=[0.0,0.5] mean ET =38.129 mean_err=0.298546
eta=[0.5,1.0] mean ET =38.3571 mean_err=0.331199
Figure 9: Track PT for positively charged candidates with ET > 30 GeV (4 different detector eta bins)
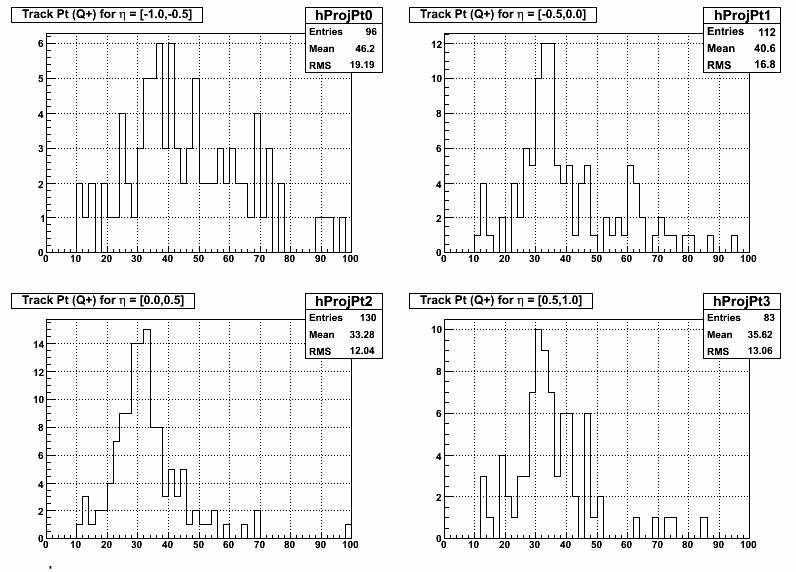
Figure 10: Thrown positron PT from Geant (4 different detector eta bins)
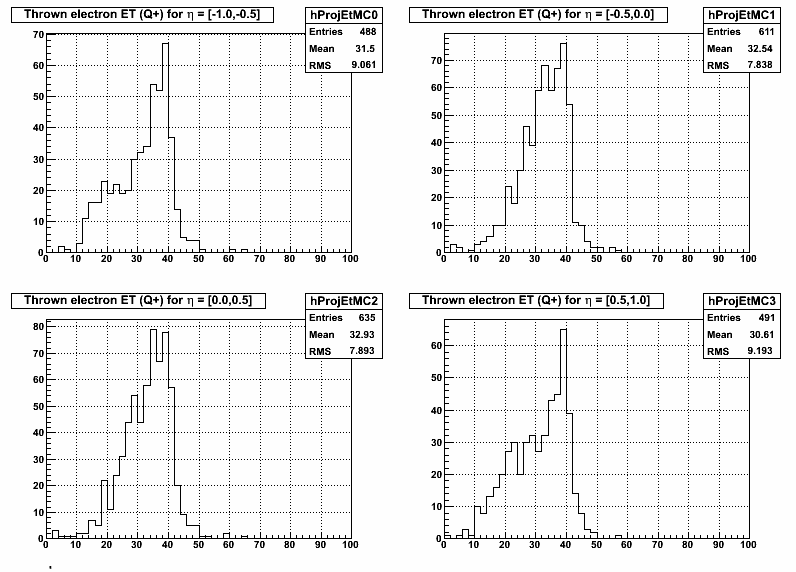
Figure 11a: E/p for positively charged candidates with ET > 30 GeV (detector eta > 0)

Figure 11b: E/p for positively charged candidates with ET > 30 GeV (detector eta < 0)
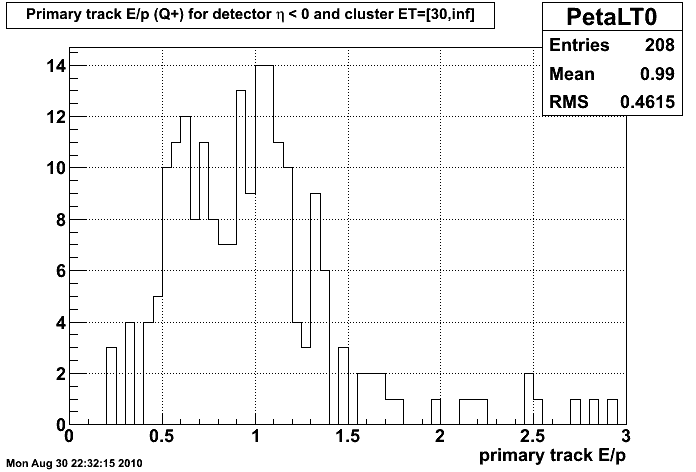
Figure 12: E/p vs detector eta for negatively charged candidates with ET > 30 GeV
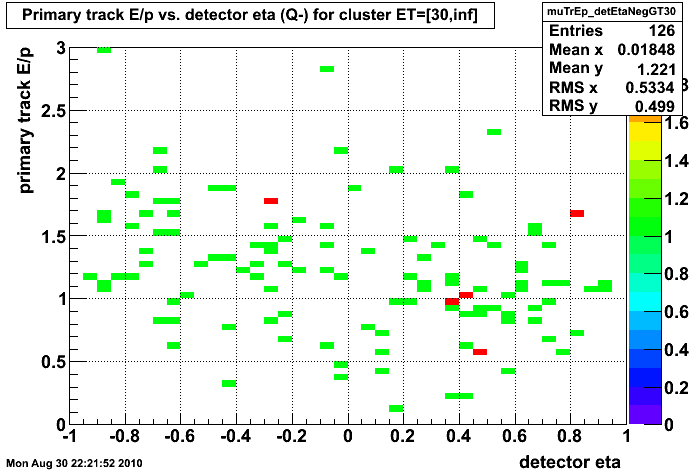
Figure 13: E/p for negatively charged candidates with ET > 30 GeV (detector eta < 0)
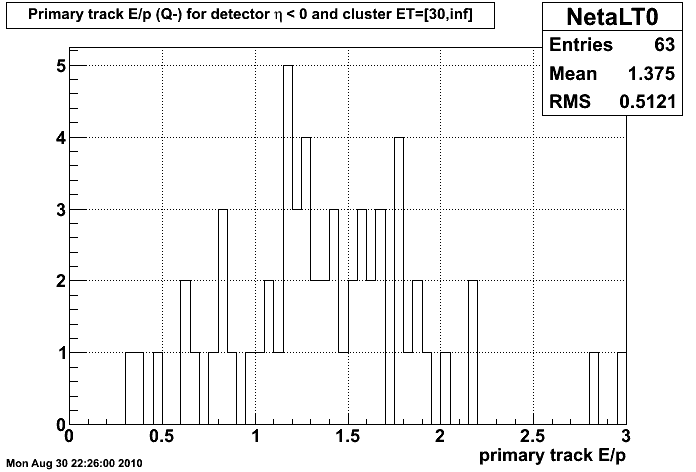
Figure 14: E/p for negatively charged candidates with ET > 30 GeV (detector eta > 0)

From Figures 6 - 14 you can see that there is a eta dependence to the E/p distributions for both e+ and e- candidates. The largest systematic shift between E/p for the tow charge signs seems to be at large negative eta. The statistics are pretty low, but there seems to be a significant charge dependent effect. I can't think of a mechanism where the BTOW could be responsible for this kind of charge dependent shift in E/p so this may indicate a limitation of this method from the TPC calibration.
Section 2: Distributions for events passing all 'nearside' W algo cuts, but failing signed pT-balance cut (ie. this is the sample used in our background subtraction procedure)
Figure 15: E/p vs 2x2 cluster ET for positive charges (left) and negative charges (right). The bottom 2 plots are the centroid of gaussian fits for the 2x2 cluster ET bins (the individual fits are shown in Fig 16 and 17). (W Background)
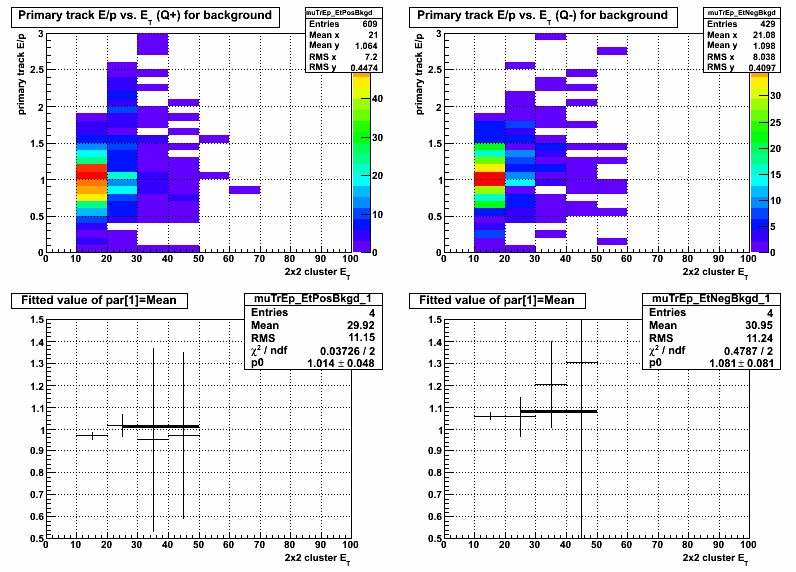
Figure 16: E/p for postive charges in slices of 2x2 cluster ET fit with a Gaussian in the range [0,2] (W Background)
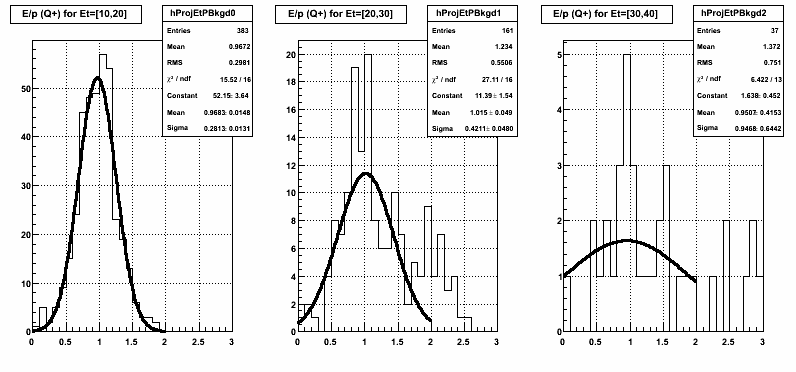
Figure 17: E/p for negative charges in slices of 2x2 cluster ET fit with a Gaussian in the range [0,2] (W Background)
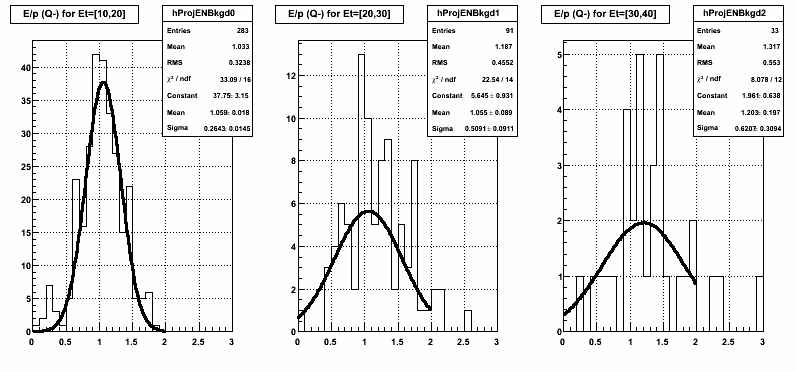
From figure 15, 16, and 17 it appears that our background sample has E/p peaked rather strongly at 1. This comes as somewhat of a surprise, since I thought the general feeling was that the background would be dominated by hadrons in jets mimicing an electron signal. This begs the question: Is our background at low ET really dominated by isolated electrons, or is there some hadronic process that mimics an isolated electron and has E/p ~ 1? Without understanding why our background peaks at E/p ~ 1 it will probably be hard to convince people that our W signal sample peaking at 1 really means anything.
So what is this W background sample (seen in fig 6-8) and why does it look so electron like?
Looking at the BSMD:
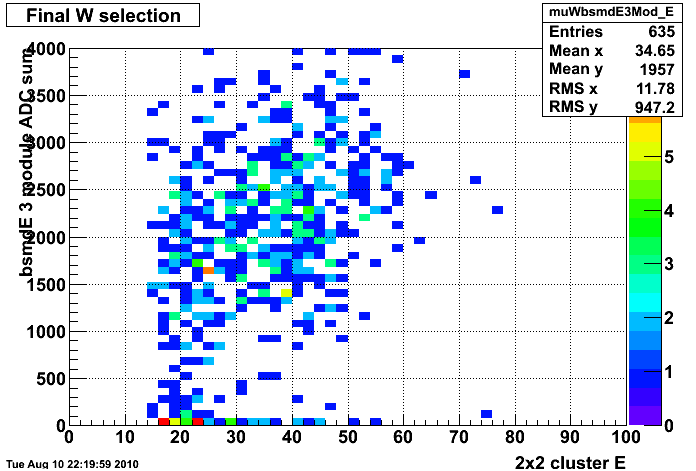
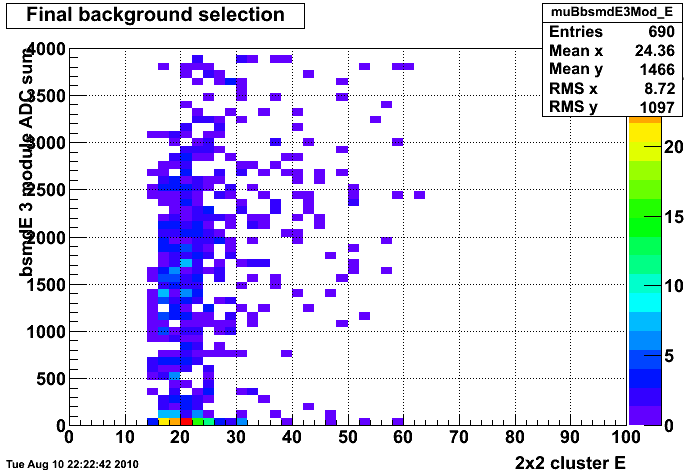
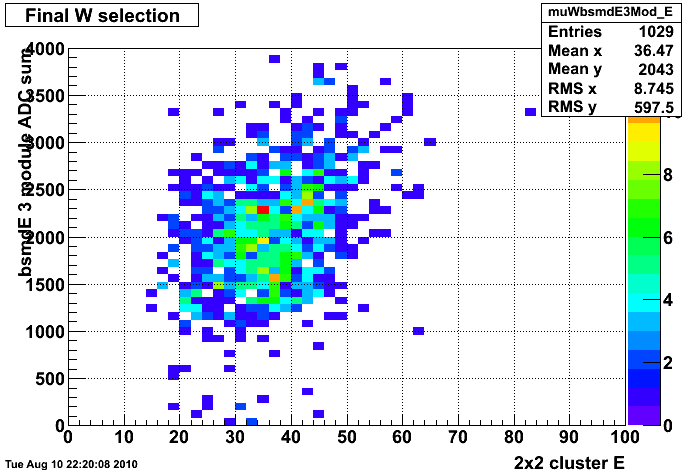
If the mechanism for this background is hadronic it is possible that the shower could start after the BSMD, thus for some background events we would expect that the energy deposited in the BSMD be a MIP. Figure 16 below shows the ADC sum of the strip pointed to by the TPC track +/- 5 strips on each side (the hit module and one module on each side are summed to give 33 strips total). Runs where the BSMD was not working have been removed, and candidates where the TPC track pointed to a module where all strip's status != 1 are also removed. Finally to remove effects near the edge of the calorimeter the detector eta is required to be |eta| > 0.05 and |eta| < 0.9.
Figure 18: BSMD eta plane ADC sum vs 2x2 cluster energy for Data signal (left) and Data background (right)
Figure 19: BSMD eta plane ADC sum vs 2x2 cluster energy for W MC signal (left) and Single thrown charged pion MC with ET=20 GeV (right)
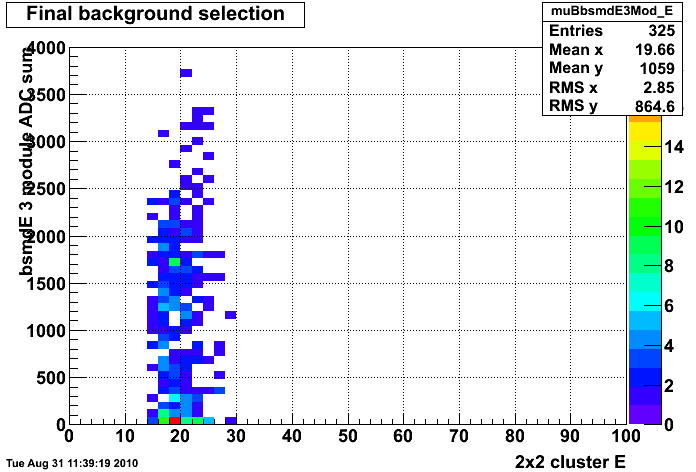
From the two figrues above it appears that the Data signal and the W MC qualitatively agree rather well in the high E region, and the Data background and charged pion MC qualitatively agree as well. The large amount of candidates with very small BSMD E in the Data background and charged pion MC are consistent with the idea that some fraction of the background candidates are showering "late" in the calorimeter and only depositing a MIPs worth of energy in the BSMD.
Background near the edge of the Barrel
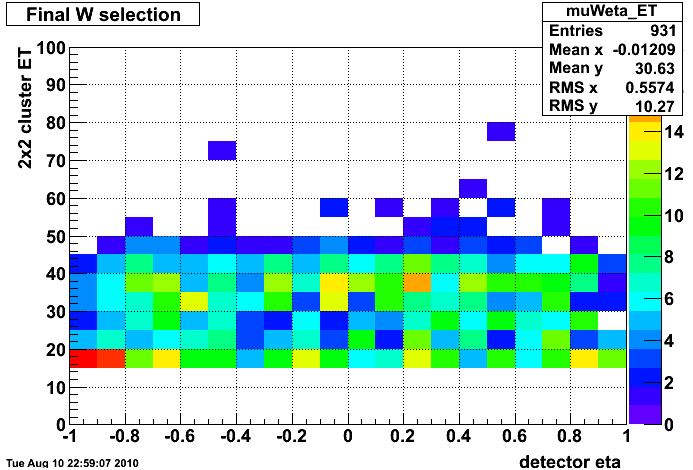
Figure 20: 2x2 cluster ET vs detector eta for W Background (left) and W Signal (right)
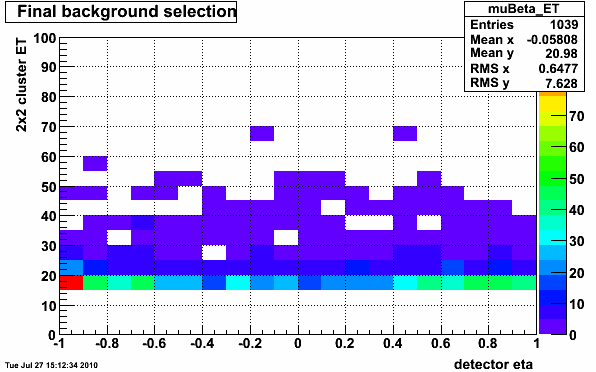
Clearly the background is peaked near |eta|=1 as should be expected (since the isolation cone doesn't work as well where the acceptance is falling off). Also the background at eta=-1 is larger than at eta=1 because there is no endcap at eta=[-2,-1] to include in the nearside isolation cone.
Figure 21: detector eta vs vertex z (W Background)
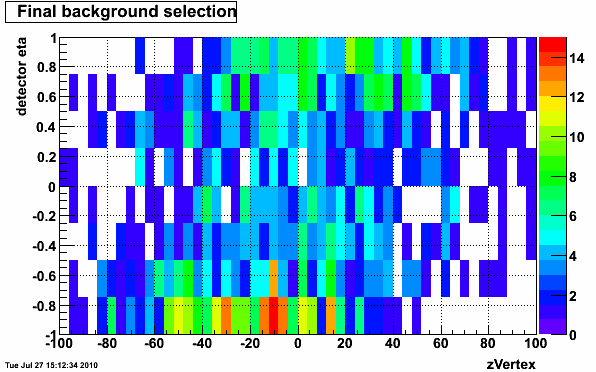
Looking in the eta bins where the background is peaked ( |eta|~1 ) the vertex distribution is pushed away from z=0. So the dominant contribution to the background comes from events with large detector eta and a displaced vertex. One effect of having this vertex z and detector eta distribution is that particles may encounter more dead material before they interact with the calorimeter as can be seen in the geometry sketch borrowed from Matt from 2006 below. I'm sure some things have changed between 2006 and 2009 geometry, but its clear that, for instance a track with vertex z = 40 and detector eta = 1 would encounter some piece of the TPC electronics at least in 2006. I'll update this figure later with the 2009 geometry.
Figure 22: 2006 geometry: tracks at eta = 0.9, 0.95, 1.0

Notes:
- In terms of the real electron contribution to the background from heavy quark decay, below is attached a plot from Phenix at the W/Z workshop where they show a prediction for the heavy quark cross section relative to the W cross section. I don't know the details of the theory prediction, but this would say that the heavy quark contribution is definitely non-negligible in the ET=[15,20] range.
More To Do:
-Improve fitting procedure to describe low statistics.
-Look at ways to improve cuts to have a sample that is more pure.
-Understand why background has E/p ~ 1. (Maybe real electrons, could look at BSMD)
-Try to understand e+/e- difference and relate it to difference Matt saw in low Et electrons (recall both FF and RFF were used in pp200 calibration and pp500 was only RFF). Postpone for now.
- stevens4's blog
- Login or register to post comments

