- stevens4's home page
- Posts
- 2014
- 2013
- 2012
- 2011
- December (1)
- November (2)
- October (1)
- September (1)
- August (2)
- July (3)
- June (7)
- May (2)
- April (2)
- March (5)
- February (2)
- January (2)
- 2010
- November (1)
- October (1)
- September (3)
- August (3)
- July (3)
- June (1)
- May (1)
- April (3)
- March (4)
- February (4)
- January (8)
- 2009
- December (4)
- November (3)
- October (4)
- September (5)
- August (1)
- July (2)
- June (2)
- April (1)
- March (1)
- February (2)
- January (1)
- 2008
- My blog
- Post new blog entry
- All blogs
More TPC distributions from L2W stream SL09g
More TPC distributions from L2W stream SL09g
Data Set:SL09g production of L2W stream events from Run 9 pp500
The data was divided somewhat arbitrarily into 4 subsets A, B, C, and D. One very notable difference is the lower TPC HV used at the end of set B and all of sets C and D.
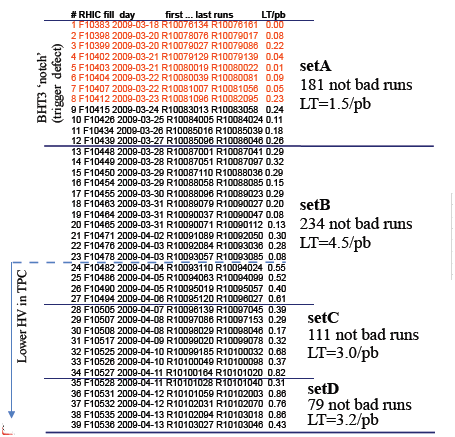
Gene suggested that I divide the data by inner TPC HV used and Luminosity (runlist for ZDC rates attached below). So the following 4 groups are divided as follows
Set E: Low luminosity (ZDC rate < 110K), high inner TPC voltage
Set F: High luminosity (ZDC rate > 110K), high inner TPC voltage
Set G: Low luminosity (ZDC rate < 110K), low inner TPC voltage
Set H: High Luminosity (ZDC rate > 110K), low inner TPC voltage
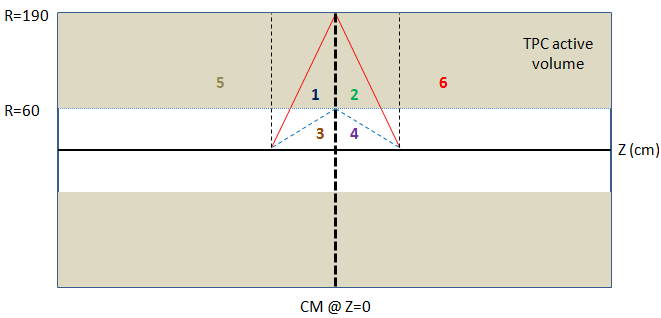
Figure 0: Definition of track geometry 'regions' for this study
Note: In the figures below the first row is set A-D and the second row is set E-H.
Track cuts applied
- Select primary vertices with rank > 0 and |z| < 100
- Require track pT > 1 GeV
Figure 1: Trach eta vs zVertex (R=60 -> blue, R=90 -> black, and R=190 -> red)
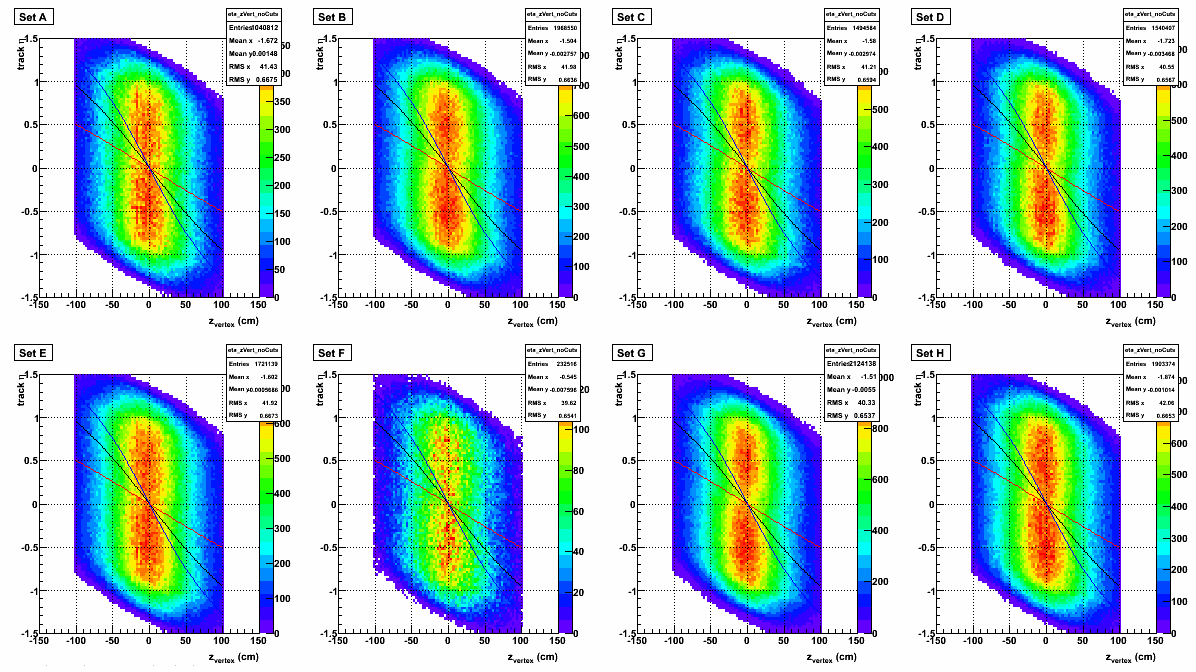
Figure 2: Tracks in Region 2 (crossing the CM)
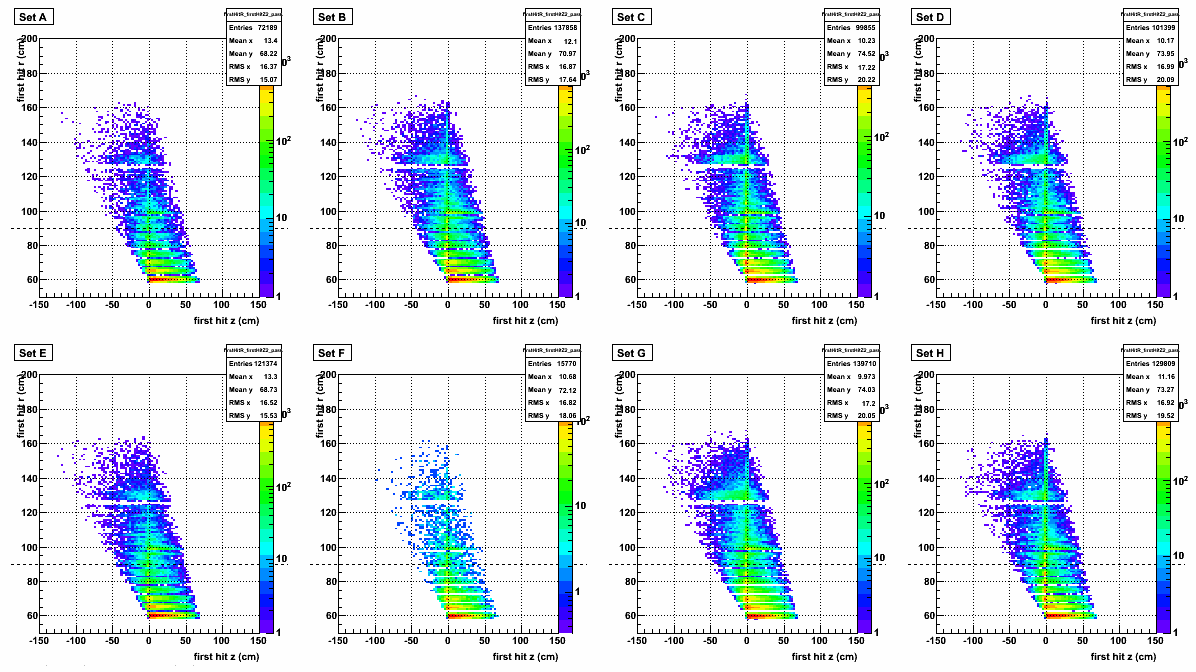
In set C and D there are more tracks with first hit z < 0 than in set A. In other words more tracks are broken across the CM. Tracks with first hit R above the dotted line are be removed by the W track cuts listed below, rejecting some tracks that are broken across the CM.
Now apply W track cuts: nHitsFit>15, nHitFrac>0.51, pT > 1 GeV, first hit R < 90 cm, and last hit R > 160 cm
Figure 3: Track eta vs zVertex passing all W cuts. The lines represent different radii along the CM (R=60 -> blue, R=90 -> black, and R=190 -> red)
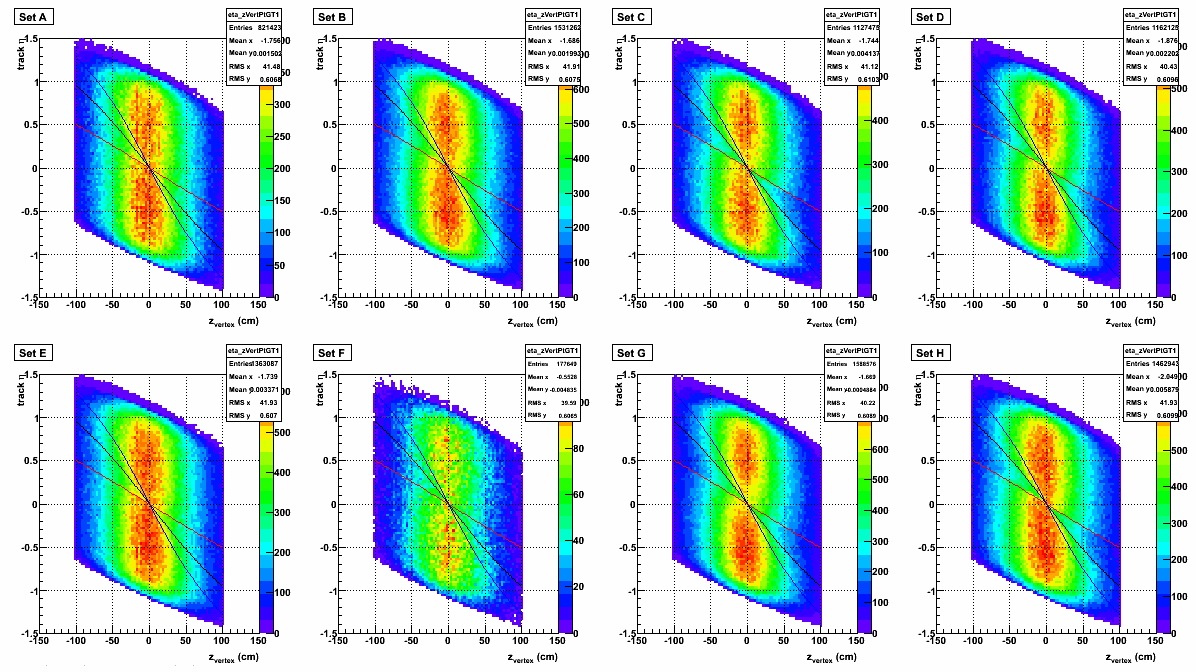
Figure 4: Track 1/R, where R is the radius that the track crosses the infinite plane at z=0 (CM plane). Tracks in this figure have zVertex<0 and eta>0. The lines represent different radii along the CM (R=60 -> blue, R=90 -> black, and R=190 -> red)
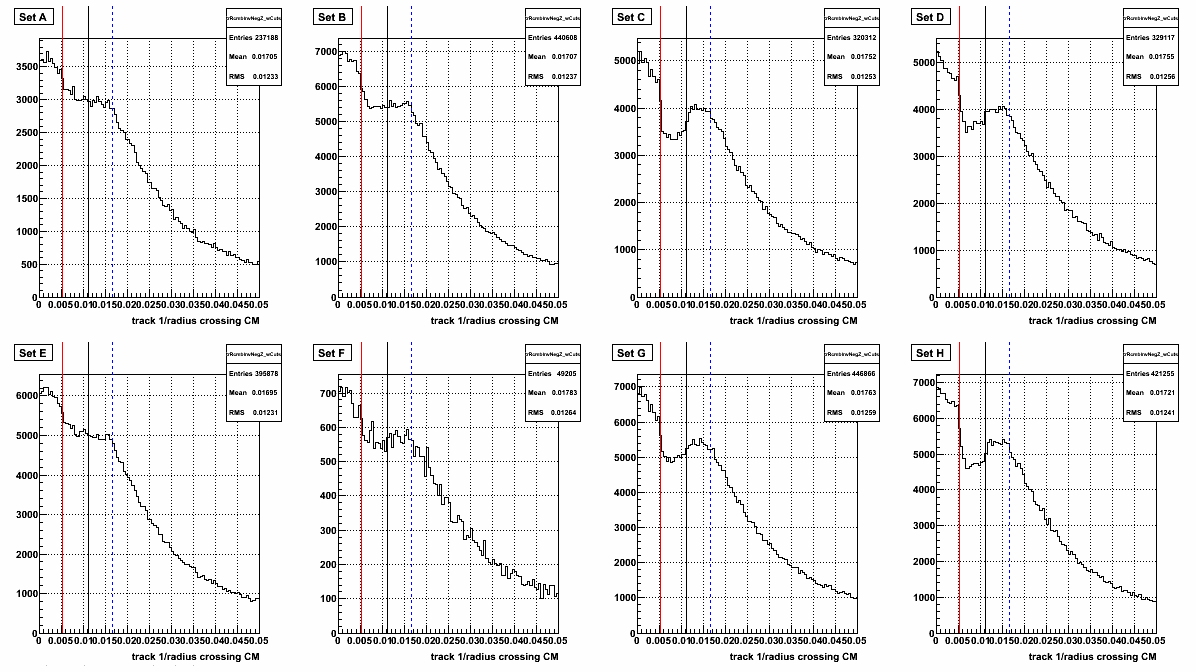
Figure 5: Track 1/R, where R is the radius that the track crosses the infinite plane at z=0 (CM plane). Tracks in this figure have zVertex>0 and eta<0. The lines represent different radii along the CM (R=60 -> blue, R=90 -> black, and R=190 -> red)
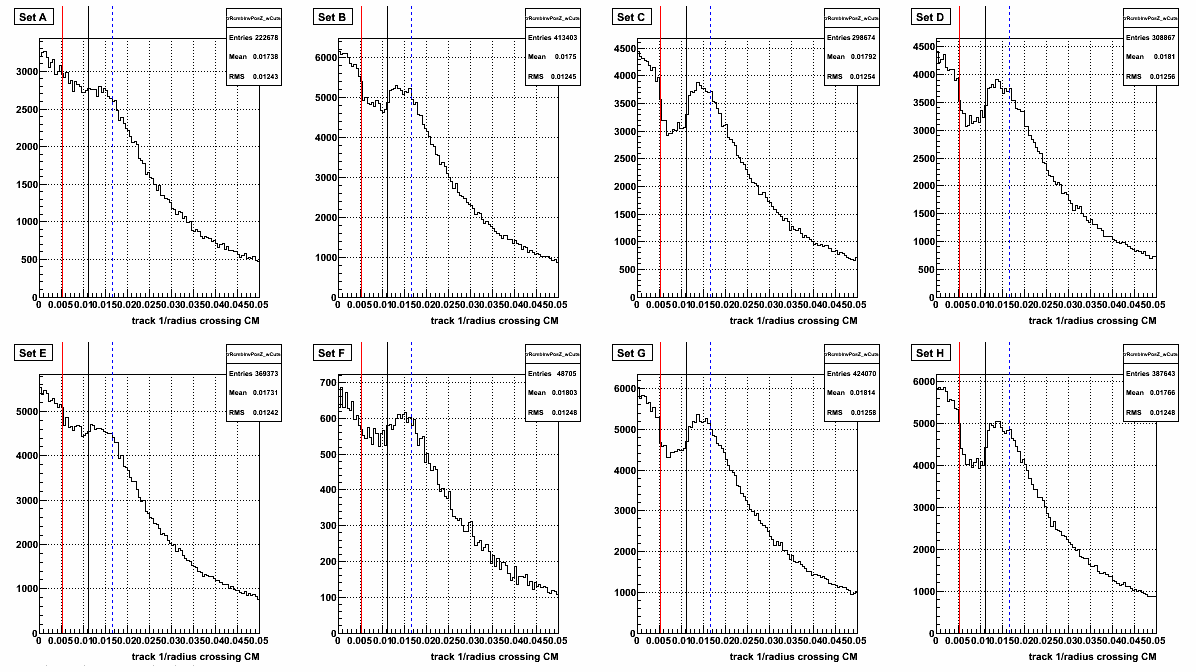
Significantly lower yield is seen for tracks crossing the CM (between red and blue lines) in set C and D, where as set A sees almost no effect and in set B the effect is reduced. One obvious possibility is that the lower TPC HV is causing this effects we see.
2 Questions for TPC experts (and responses from Joe):
a) Is the calibration of Space Charge and Gridleak sensitive to TPC HV?
--> Spacecharge should at first order not be sensitive to the TPC HV. See below for gridleak answers.
b) Was the calibration done for both sets of HV, or just one?
--> I did a separate SC&GL for each HV setting, but basically no difference was seen between the two periods. The GL should in principle be sensitive to the TPC HV, but it depends on how much of the GL is coming from the inner sectors and the outer sectors. If the predominant amount is coming from the outer sector then no real effect should be seen because the HV was not lowered (right Gene?) on the outer sectors, just the inner sectors.
Another thing to consider if that if there is a mis-calibration in the SC&GL, which I currently do believe, that the effect will be worse at higher luminosity. It would be interesting to correlate the eta dip effect which luminosity, rather than with these HV periods, or give the average zdcx rate for each of the periods or something to that effect.
Distributions unrealted to tracks crossing the CM
1) Mid-rapidity inefficiency
Aside from the obvious inefficiency for tracks crossing the CM, there appears to be another track reconstruction inefficiency at small eta for forward pointing tracks (ie. zVertex*eta > 0). For this we will look at regions 5 and 6 where the entire track is reconstructed on one half of the TPC.
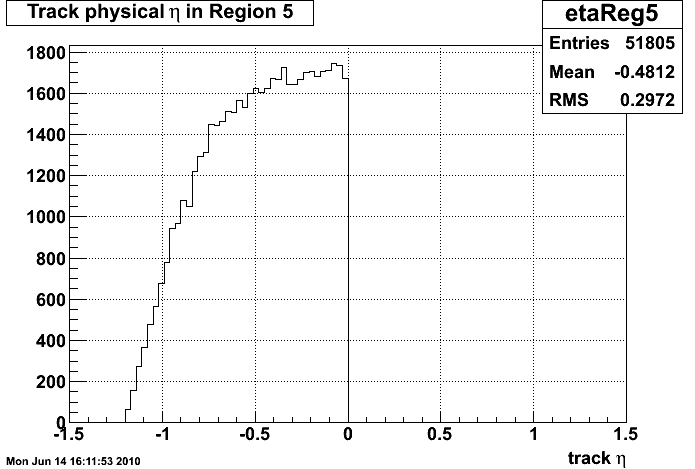
Figure 6: Eta of tracks in Region 5 (zVertex < 0 && eta < 0)
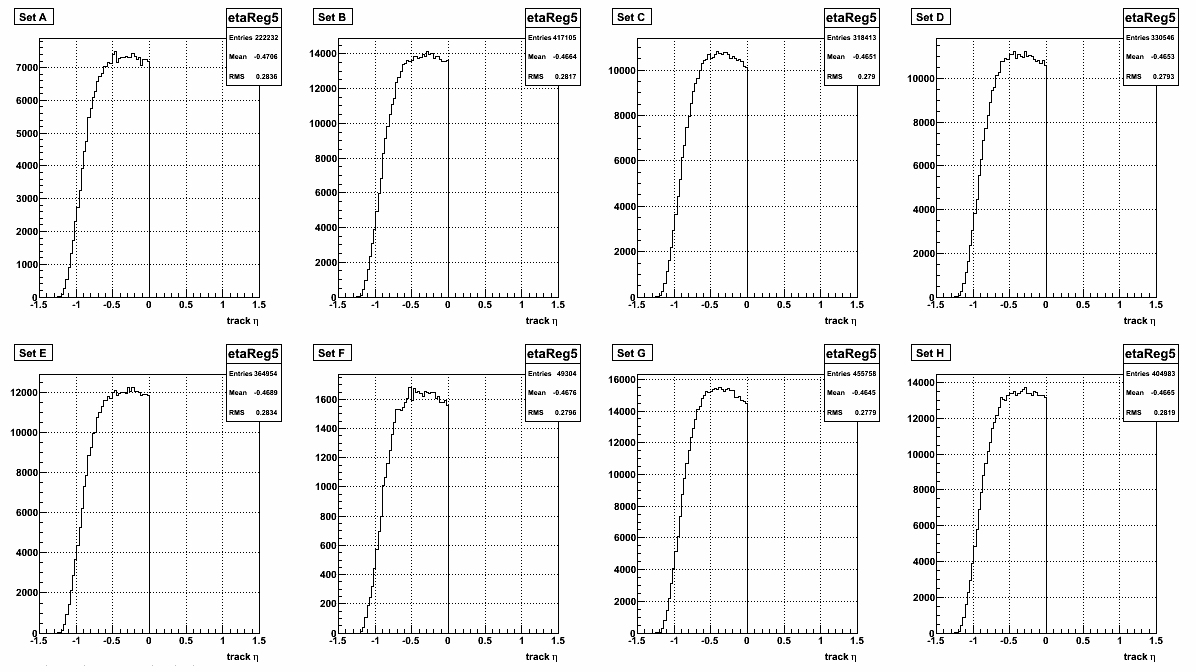
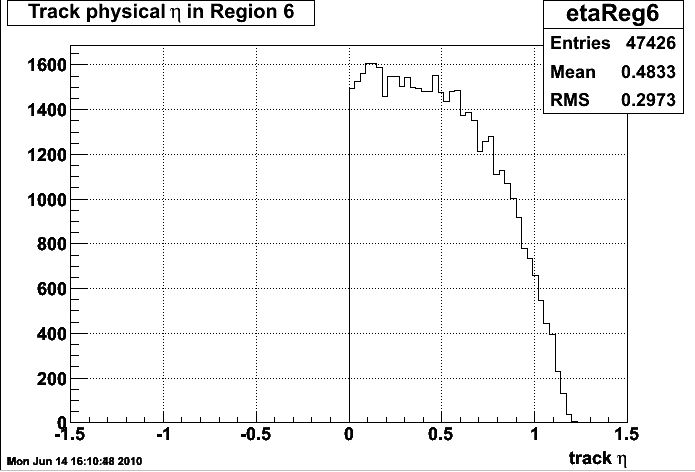
Figure 7: Eta of tracks in Region 6 (zVertex > 0 && eta > 0)
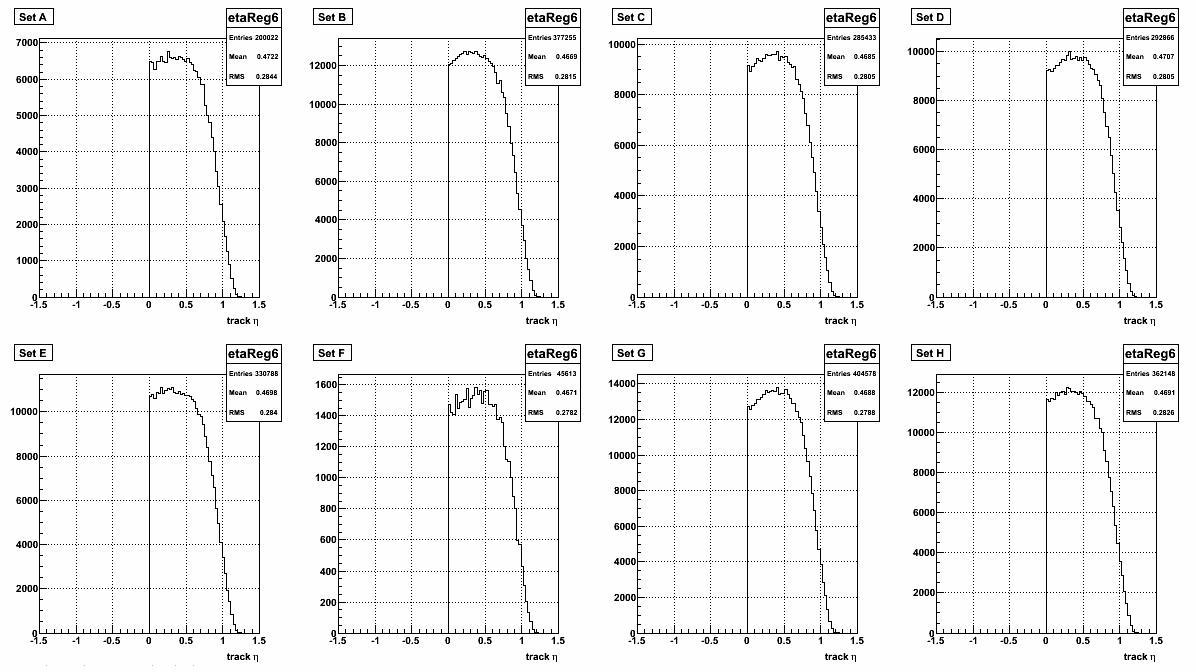
Again set A looks ~flat in eta as I would expect, but there is a lower yield in Set B, C, and D as eta -> 0 (especially set C and D). Could the same mis-calibration leading to problems as tracks cross the CM cause this inefficiency as well?
Gene had a possible concern involving track pseudorapidity and rapidity differences that could cause the dip at eta~0. Here are plots for QCD MC (with partonic pT > 15 GeV) for region 5 and region 6 that show we do not expect a dip at eta~0 in the inclusive particle spectra (unless somehow the L2W trigger is causing this?).
2) Is the track Z DCA offset for Region 4?
Another possibility for some loss of efficiency could be a miscalibrated T0 offset which might be seen as an offset in the Z DCA for tracks whose zVertex > 0, but all the ionization in the TPC occurse for Z < 0 (ie. region 4).
Figure 8: Z DCA for Region 4
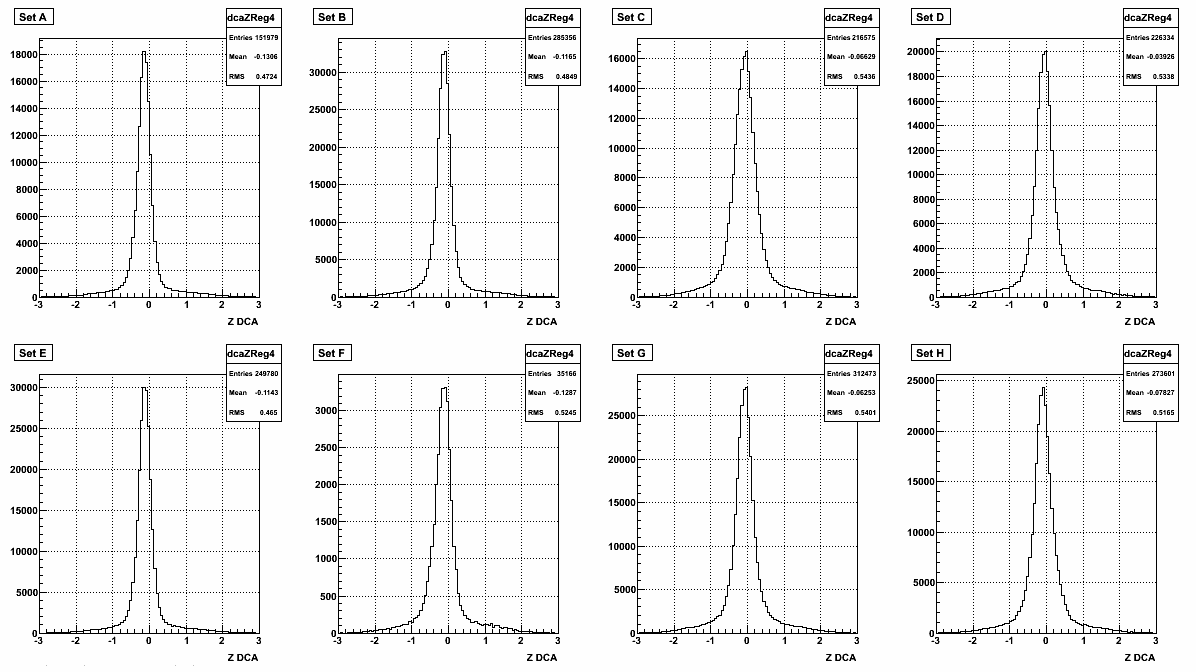
Figure 9: Z DCA for Region 6
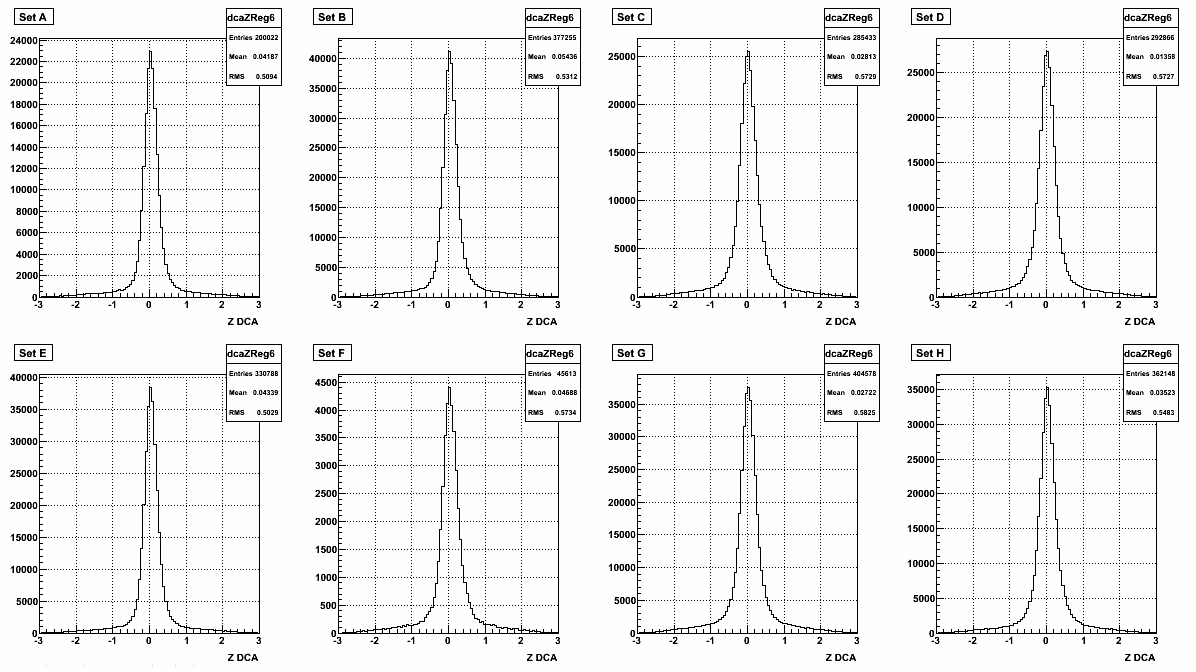
I don't know if this a sizeable effect or not, but the Z DCA for region 4 is offset from 0, probably due to the fact that the track is reconstructed on the east half of the TPC, and the vertex is reconstructed from tracks on both sides of the TPC. However for region 6, where the track and zVertex are on the same half of the TPC, the distributions are peaked closer to 0.
Also the distributions from set C and D are broader in both Region 4 and 6 than the distributions in set A and B.
There are plots for region 3 and 5 that show similar offsets but in the opposite direction.
Groups:
- stevens4's blog
- Login or register to post comments