- stevens4's home page
- Posts
- 2014
- 2013
- 2012
- 2011
- December (1)
- November (2)
- October (1)
- September (1)
- August (2)
- July (3)
- June (7)
- May (2)
- April (2)
- March (5)
- February (2)
- January (2)
- 2010
- November (1)
- October (1)
- September (3)
- August (3)
- July (3)
- June (1)
- May (1)
- April (3)
- March (4)
- February (4)
- January (8)
- 2009
- December (4)
- November (3)
- October (4)
- September (5)
- August (1)
- July (2)
- June (2)
- April (1)
- March (1)
- February (2)
- January (1)
- 2008
- My blog
- Post new blog entry
- All blogs
TPC tracking efficiency at mid-rapidity
TPC tracking efficiency at mid-rapidity
In order to understand the inefficiency of the tracking at mid-rapidity in the data Gene suggested to look at the <z> of the track for the MC/data ratio. The plots below show these ratios after removing the sectors in the TPC that were dead at some point during the run (these are sectors 4,5,6,11,20 for more info see Gene's blog). Also for figure 3 the tracks that cross the TPC central membrane have been removed to see if this could lead to what we see in the data.
Data: Run 9 L2W sample
MC: PYTHIA QCD sample (partonic pT > 35 GeV)
Ratio MC/Data
A) Including tracks that cross the Central Membrane
Figure 1: Average z from the first and last hit on track
.png)
Figure 2: Track phi vs average z from the first and last hit on track
.png)
B) Tracks that cross the Central Membrane are removed
Figure 3: Average z from the first and last hit on track (tracks crossing the central membrane are removed)
.png)
Figure 4: Track phi vs average z from the first and last hit on track (remove tracks crossing the central membrane)
.png)
Binning in particle eta
Joe suggested to look at these same ratio plots (ie. figure 3 and 4) binned in particle eta (or 'tilted' and 'straight' tracks). These plots are in a pdf file here with the particle eta bin given in the title of the plot.
Signed DCA
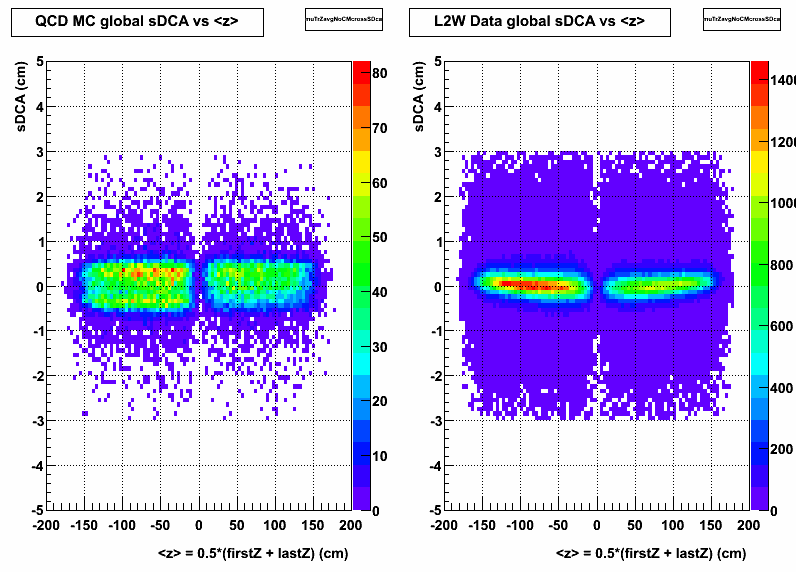
Figure 5: Signed DCA for MC (left) and data (right)

These distributions look pretty different, but I'm not sure if it has something to do with the mis-match of the beamline offset in kumac and BFC.
Vertex Z distribution ratio
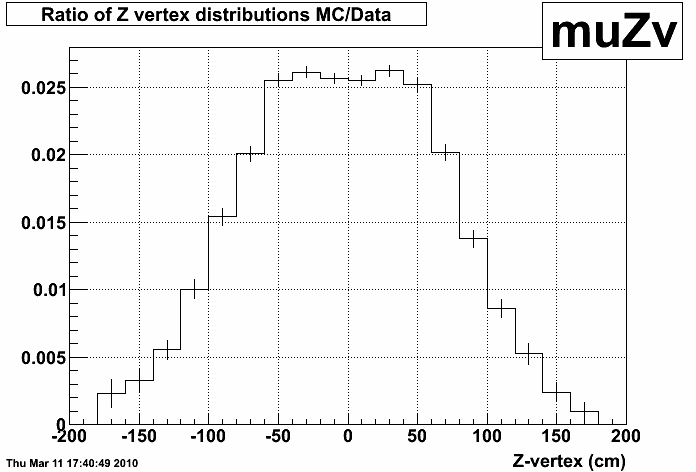
Figure 6: Ratio MC/Data of Z vertex distributions

In figure 6 you can see the ratio is flat near Z=0 since we matched the sigma fairly well, but we don't sample the tails very well in the simulation.
- stevens4's blog
- Login or register to post comments
