- stevens4's home page
- Posts
- 2014
- 2013
- 2012
- 2011
- December (1)
- November (2)
- October (1)
- September (1)
- August (2)
- July (3)
- June (7)
- May (2)
- April (2)
- March (5)
- February (2)
- January (2)
- 2010
- November (1)
- October (1)
- September (3)
- August (3)
- July (3)
- June (1)
- May (1)
- April (3)
- March (4)
- February (4)
- January (8)
- 2009
- December (4)
- November (3)
- October (4)
- September (5)
- August (1)
- July (2)
- June (2)
- April (1)
- March (1)
- February (2)
- January (1)
- 2008
- My blog
- Post new blog entry
- All blogs
TPC efficiency phi dependence in data/MC comparison
TPC efficiency phi dependence in data/MC comarison
Data: Run 9 L2W sample
MC: PYTHIA QCD sample (partonic pT > 35 GeV)
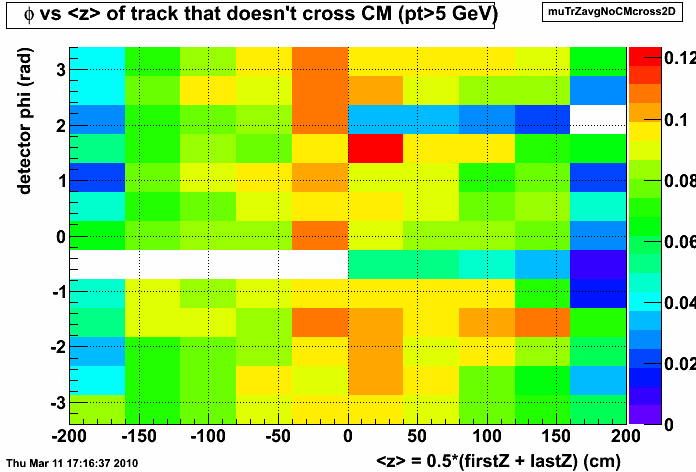
Figure 1: Ratio of MC/Data tracks phi vs. <z> (remove tracks crossing CM). The bins in phi are the TPC sectors (except for sector 9 and 15 which are split in half across +/- pi)

The non-uniformity in phi of this ratio over TPC sectors could be caused by a poor choice of timestamps used in producing the simulation. Gene's blog describes the re-weighting of our simulation sample to better represent the TPC dead regions in the data during the 500 GeV portion of Run 9. This weighting of sectors 4, 5, and 11 is applied for figure 2.
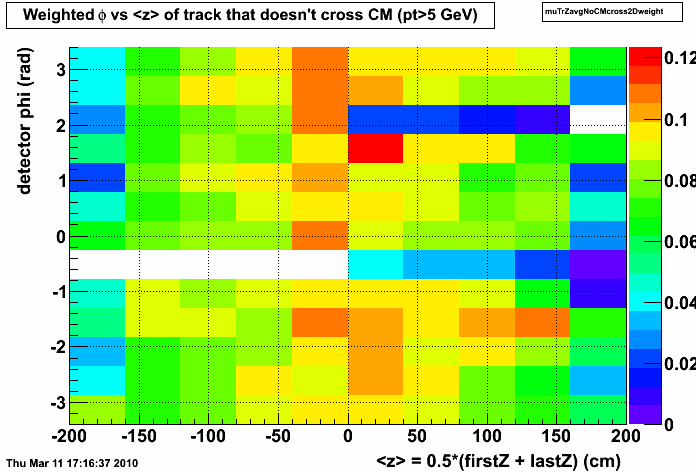
Figure 2: Ratio of "weighted MC" / Data tracks phi vs. <z> (remove tracks crossing CM).

For sectors 4 and 11we see the ratio is decreased since we weighted the timestamps with dead regions more strongly. So as Gene pointed out in his blog, this re-weighting goes the "wrong way". Also for sector 5 the effect is small so this confirms the suspicion that this dead region doesn't effect the sectors efficiency much.
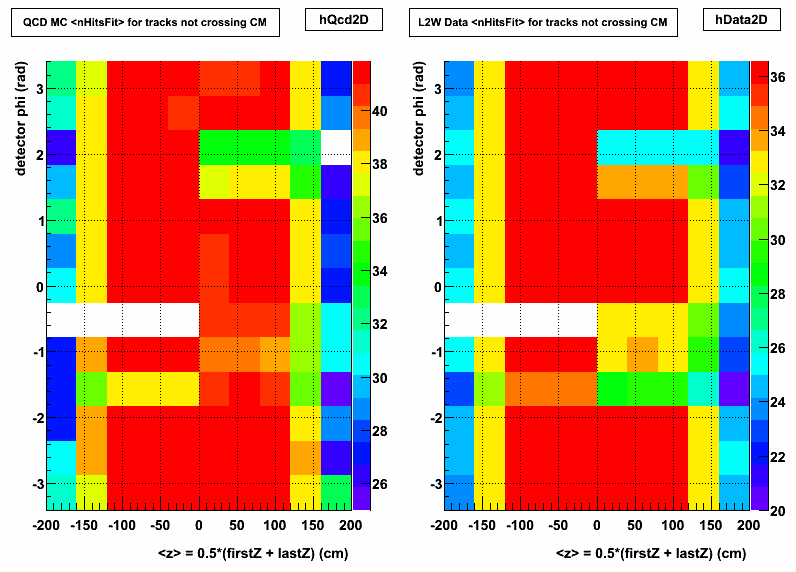
Joe suggested that another intereseting quantity to look at is the average number of fit points ("nHitsFit") for tracks in each <z>,phi bin.
Figure 3: <nHitsFit> for tracks in each <z>,phi bin

- stevens4's blog
- Login or register to post comments
