- stevens4's home page
- Posts
- 2014
- 2013
- 2012
- 2011
- December (1)
- November (2)
- October (1)
- September (1)
- August (2)
- July (3)
- June (7)
- May (2)
- April (2)
- March (5)
- February (2)
- January (2)
- 2010
- November (1)
- October (1)
- September (3)
- August (3)
- July (3)
- June (1)
- May (1)
- April (3)
- March (4)
- February (4)
- January (8)
- 2009
- December (4)
- November (3)
- October (4)
- September (5)
- August (1)
- July (2)
- June (2)
- April (1)
- March (1)
- February (2)
- January (1)
- 2008
- My blog
- Post new blog entry
- All blogs
EEMC electrons: Run 6 vs Run 9
EEMC electrons: Run 6 vs Run 9
This is a first attempt at comparing electrons from Run 6 and Run 9 data. The idea of this analysis is to provide another point of comparison between the Run 6 and Run 9 gains. The Run 6 data comes from the "golden list" of runs used in the Run 6 inclusive jet analyses. The Run 9 data is from the list Pibero used for his recent inclusive jet analysis, passing all his and Grant's QA. Also the Run 9 dataset only includes data after the MAPMT boxes had their TCD phase adjusted correctly (so cuts could be placed on EPRE/EPOST/ESMD for electron ID). The list of cuts imposed to select electrons is similar to those used for the BEMC and in Naresh's thesis.
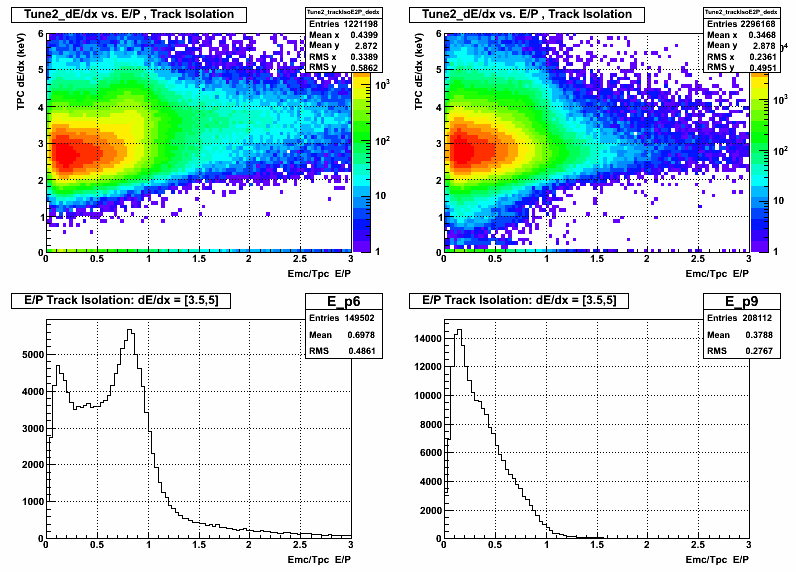
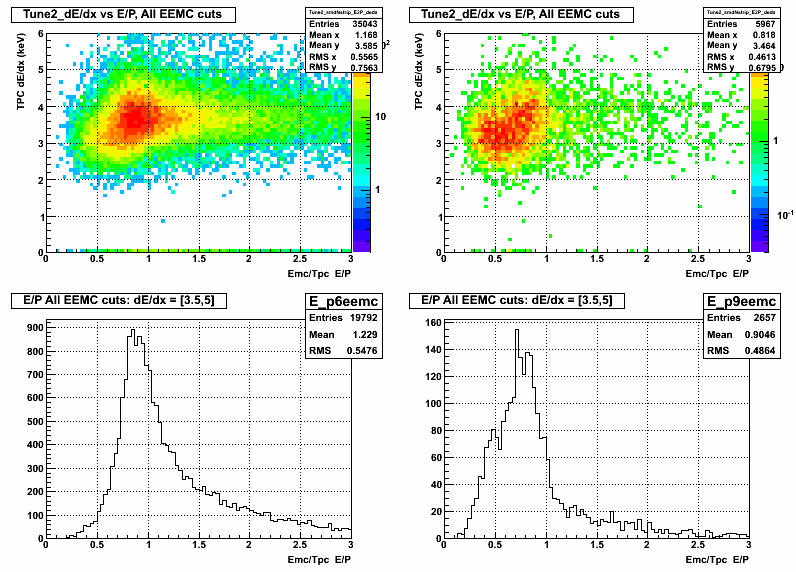
Note: For all figures below the left column is Run 6 data and the right column is Run 9 data. The number of input tracks is approx. the same.
The first cuts used to generate the trees are:
- |Vertex Z| < 120 cm
- Only use first vertex w/ rank > 0
- Track nFit/nPoss > 0.51
- Track eta > 0.3
- Track points to EEMC tower
Figure 1: dE/dx vs P (upper row) and dE/dx for P > 1.5 (lower row)

The electron band in dE/dx should appear between 3.5 and 5 for tracks with P > 1.5 GeV. In the Run 6 plot (left) there is an enhancement in this region that is not seen in the Run 9 plot (right). Also the RMS of the Run 6 dE/dx distribution is larger than in Run 9.
Some additional cuts applied on the electron trees are:
- Track enters and exits same tower
- Track is 2 cm from tower edge
- Track pT > 1.5 GeV
- No tower in 3x3 cluster has more than 0.5 * central tower
- No other tracks point to 3x3 cluster
After these cuts are applied to the electron trees the resulting yields are shown in figure 2 below.
Figure 2: dE/dx vs E/P (upper row) and E/p for dE/dx = [3.5,5] (lower row)

In the Run 6 plot (left) even with these minimal cuts there is a peak in E/p near 1 as one would expect. There is no similar peak in the Run 9 plot (right). The SVT was removed between Run 6 and Run 9, so one source of material for conversion electrons in Run 6 was not there in Run 9. Could it be this big of an effect?
Some further EEMC specific cuts are applied to try to "clean up" the sample:
- Preshower 1 E > 2.1 MeV
- Preshower 2 E > 4.2 MeV
- log( smd_U E + smd_V E ) > 1.6
- Postshower E < 0.2 MeV
After these cuts are applied the resulting yields are shown in Figure 3 below.
Figure 3: dE/dx vs E/P (upper row) and E/p for dE/dx = [3.5,5] (lower row)

With these additional cuts there is a rather nice peak in E/p in the Run 6 plot (left) with a sizeable yield remaining. In the Run 9 data (right) it looks like there may be a peak in the E/p spectrum that has been dug out of the background, but the yield really small.
Summary:
One big difference between Run 6 and Run 9 is the material in front of the endcap (no SVT in Run 9). This should cause some reduction in the number of conversion electrons headed toward the EEMC which could account for this reduction in electron yield. If this is really the cause for the lower yield (and not some bug in my code) then it looks like electrons are not a viable EEMC calibration option in Run 9 and possibly future runs (with low material in from of the endcap).
- stevens4's blog
- Login or register to post comments
