- stevens4's home page
- Posts
- 2014
- 2013
- 2012
- 2011
- December (1)
- November (2)
- October (1)
- September (1)
- August (2)
- July (3)
- June (7)
- May (2)
- April (2)
- March (5)
- February (2)
- January (2)
- 2010
- November (1)
- October (1)
- September (3)
- August (3)
- July (3)
- June (1)
- May (1)
- April (3)
- March (4)
- February (4)
- January (8)
- 2009
- December (4)
- November (3)
- October (4)
- September (5)
- August (1)
- July (2)
- June (2)
- April (1)
- March (1)
- February (2)
- January (1)
- 2008
- My blog
- Post new blog entry
- All blogs
ZB event weighting for Run 9 W x-section embedding request
ZB event weighting for Run 9 W x-section embedding request
For the Run 9 W x-section analysis there are 584 QA'd runs listed here to be used in the analysis. For the embedded simulation to accurately represent the data used in the analysis we need 2 things
1) Sample zdc rate correctly (pile-up effects, etc.)
2) Sample detector acceptance changes correctly (dead regions effect on tracking efficiency, etc.)
There are ~12.5K zero bias events with ADC information from these 584 runs, however some events will need to be used multiple times to get the correct sampling of data taking conditions described above. The procedure described below was used to determine this "repeat factor" for each run's ZB events.
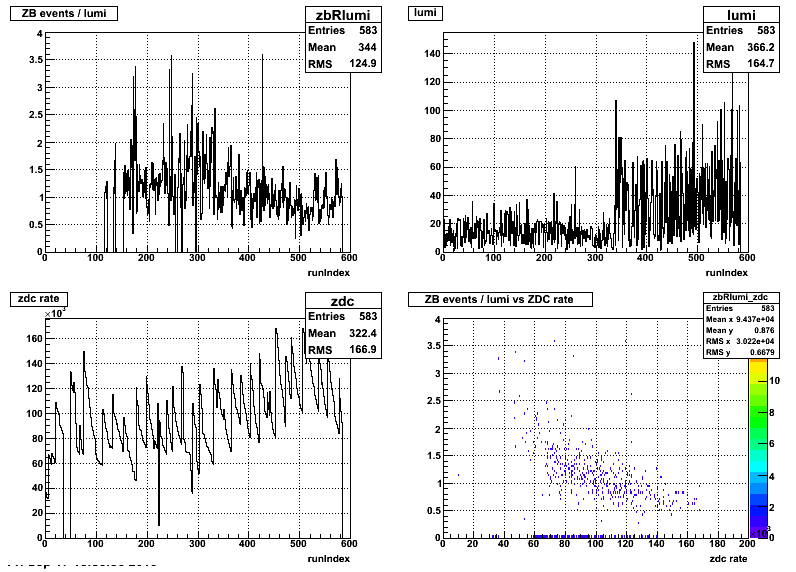
Ideally the "repeat factor" for each run's ZB events would make the ratio of (number of ZB events) / (integrated luminosity) per run a constant so that both ZDC rate and detector acceptance are sampled well. In Figure 1 below you can see this is not the case, as the first ~150 runs have no ZB data and at high runIndex the ratio decreases. The luminosity comes from Ross's preliminary APS luminosity table, when the final table is completed I'll repeat the analysis.
Figure 1:

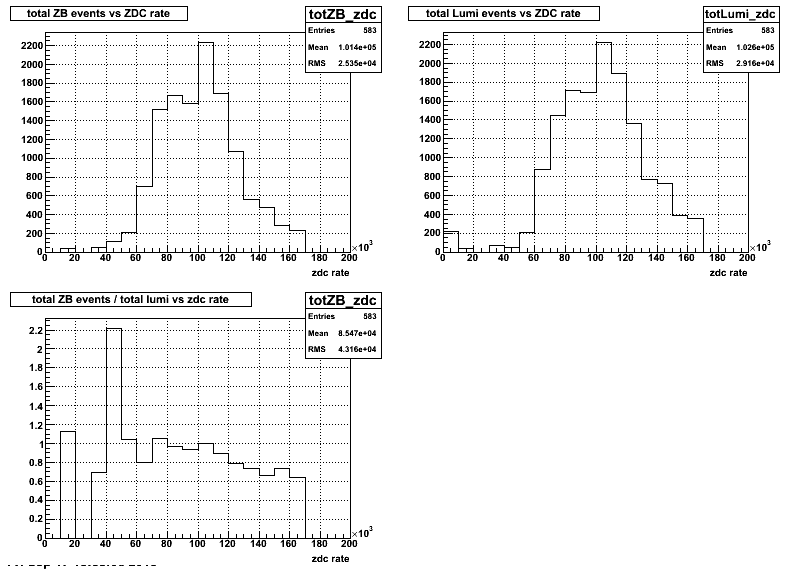
In Figure 2 you see the ratio of (ZB events) / (integrated luminosity) decreases with zdc rate, so some of the high zdc rate run's ZB events will have to be reused.
Figure 2:

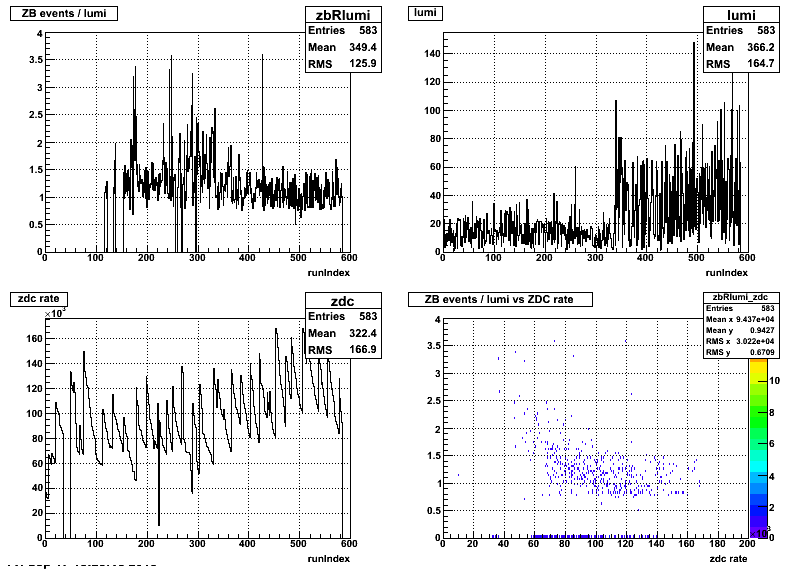
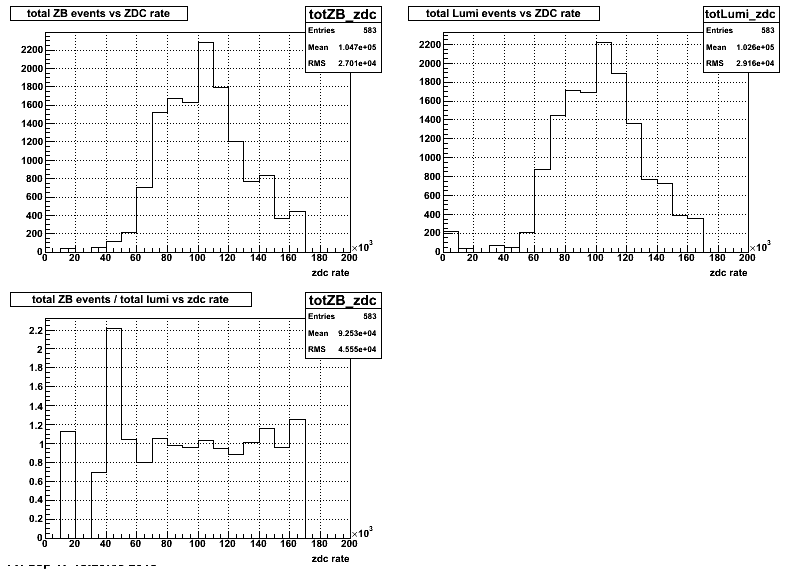
Based on figure 1 and 2 above I decided to reuse the runs where the (ZB events) / (luminosity) < 0.75. The figures below show the resulting distributions when the number of zero bias events is "doubled" for these runs by reusing the events.
Figure 3:

Figure 4:

So after re-using some runs, are the goals stated above accomplished?
1) Figure 4 shows the (total number of ZB events) / (total luminosity) is ~constant vs zdc rate giving us good sampling of the luminosity conditions (zdc rate).
2) From Figure 3 you can see that the (number of ZB events) / (luminosity) is still not constant vs runIndex, but this is necessary to account for the fact that the first ~150 runs (~20% of the integrated luminosity) have no ZB events. So we are using more ZB events, relative to the integrated luminosity, for runs with index ~[150,350] to account for these early runs with no ZB events. This is reasonable as the detector acceptance didn't change significantly over this time.
a) TPC dead regions: only 3 TPC sectors had portions of sectors go dead during this time:
| Sector | ZB/lumi before dead | ZB/lumi after dead |
| 4 | 0.85 | 1.07 |
| 5 | 0.91 | 1.07 |
| 11 | 0.13 | 1.14 |
So sectors 4 and 5 the ZB events are weighted reasonably well compared to the lumi, but for sector 11 there are almost no ZB events before the region of this sector went dead so it will be over-efficient in the embedded simulation .compared to the data This will have to be taken into account when the final efficiency values are determined, but it should be a small effect in the x-section analysis.
b) BTOW dead regions: only 3 regions were dead during some portion of Run 9 pp500 (see lower statistic regions of this plot)
| Region | % of data sample when region is dead | % of embedding sample when region is dead | |
| eta | phi | ||
| [0.2,0.4] | [-1.0,-0.6] | 9.67 | 0.47 |
| [0.0,1.0] | [-0.4,-0.2] | 17.19 | 21.55 |
| [0.0,0.2] | [-0.2,0.2] | 57.71 | 63.30 |
Each region is less than 2% of the total BTOW acceptance so some small differences in the sampled dead regions are allowable. These 3 regions are slightly under-efficient in the embedded simulation compared to the data, so a correction can be made of the final efficiencies if necessary.
The total number of ZB events to be used in the embedding samples is 13647 so the embedded samples should have requested sizes of N*13647, where in N is an integer. The list of runs with ZB events and the "repeat factor" for each run is attached below.
- stevens4's blog
- Login or register to post comments
