- stevens4's home page
- Posts
- 2014
- 2013
- 2012
- 2011
- December (1)
- November (2)
- October (1)
- September (1)
- August (2)
- July (3)
- June (7)
- May (2)
- April (2)
- March (5)
- February (2)
- January (2)
- 2010
- November (1)
- October (1)
- September (3)
- August (3)
- July (3)
- June (1)
- May (1)
- April (3)
- March (4)
- February (4)
- January (8)
- 2009
- December (4)
- November (3)
- October (4)
- September (5)
- August (1)
- July (2)
- June (2)
- April (1)
- March (1)
- February (2)
- January (1)
- 2008
- My blog
- Post new blog entry
- All blogs
First Draft of Run 9 Cross Section Paper Figures
Figure 1: Isolation cut description plots.
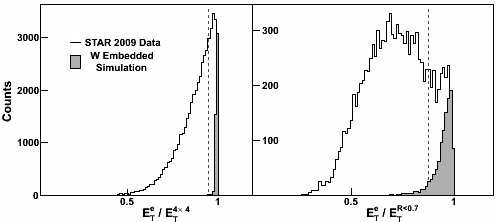
Figure 2: Signed Pt-Balance plot Data and MC
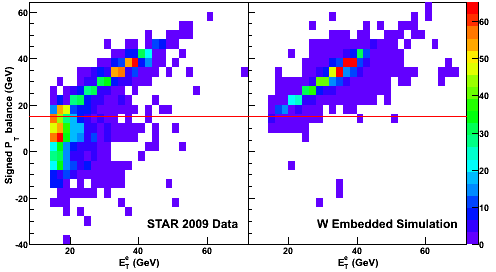
or
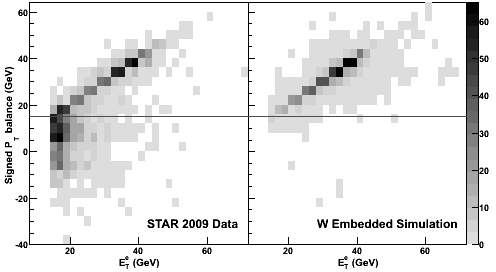
Figure 3: 1D charge sign separation plot for E_T > 25 GeV.
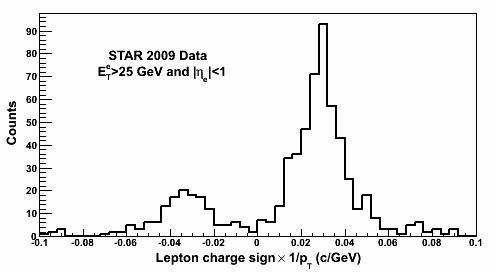
Figure 4: Reduction in background after different cuts are applied for W signal.
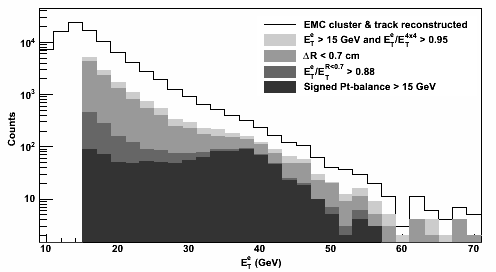
Figure 5: Reduction in background after different cuts are applied for Z signal.
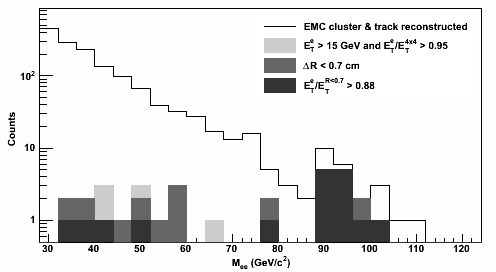
Figure 6: Data/MC comparison vs ET. All backgrounds and W MC signal are "stacked" on top of each other to show relative contributions compared to raw data without any background submtraction.
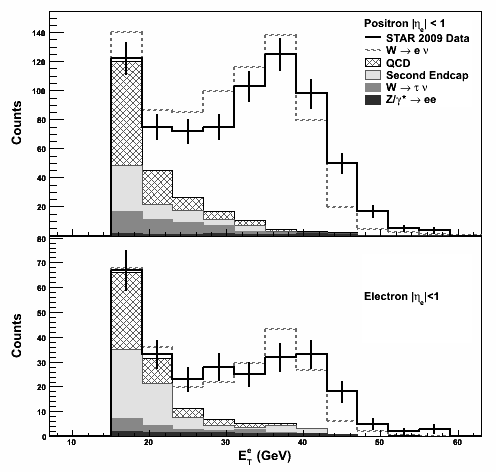
Figure 7: Data/MC comparison vs ET where the data is background subtracted for comparison to just the W MC signal yield.
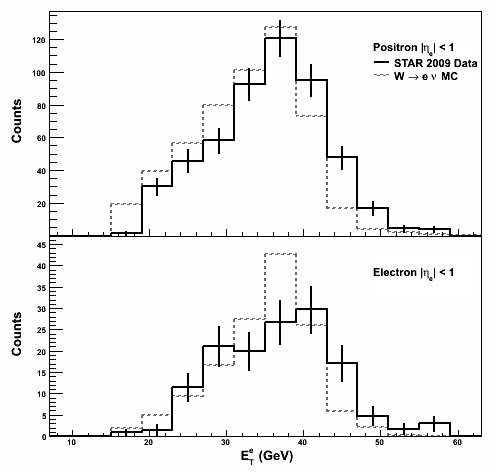
Figure 8: Data/MC comparison vs eta.
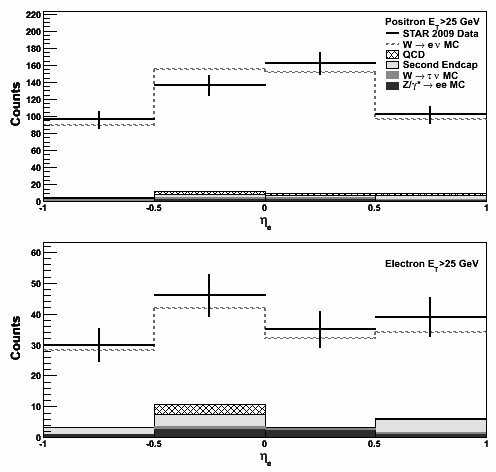
Figure 9: Z/gamma* Data/MC comaprison.
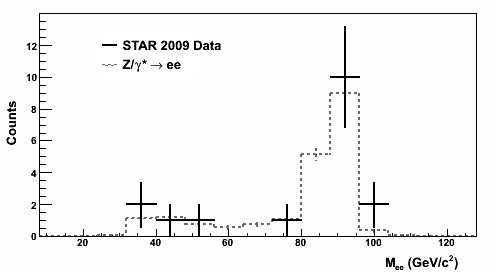
Figure 10: Sigma*BR for W and Z/gamma*. I still need to get Tevatron and UA2 points, on the ppbar curve.
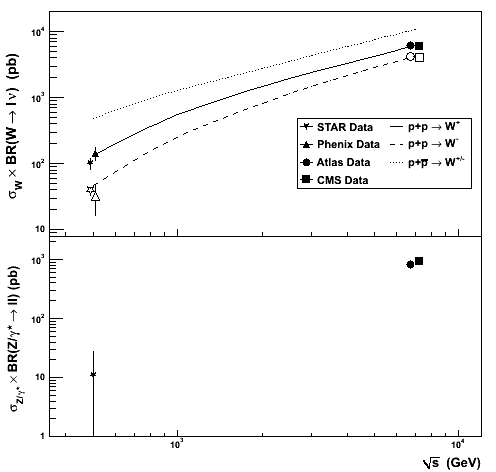
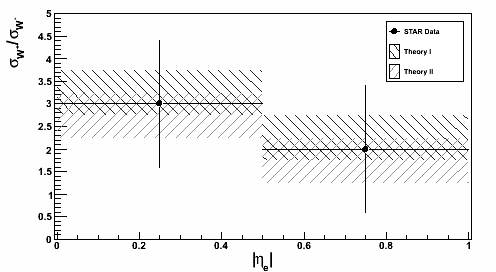
Figure 11: Cross section ratio, sigma(W+)/sigma(W-). The points are purely place holders at this point. Arbitrary theory predictions are superimposed on the plot, hopefully we'll have a couple PDFs and the associated PDF uncertainties for these hatched bands.
- stevens4's blog
- Login or register to post comments
