- stevens4's home page
- Posts
- 2014
- 2013
- 2012
- 2011
- December (1)
- November (2)
- October (1)
- September (1)
- August (2)
- July (3)
- June (7)
- May (2)
- April (2)
- March (5)
- February (2)
- January (2)
- 2010
- November (1)
- October (1)
- September (3)
- August (3)
- July (3)
- June (1)
- May (1)
- April (3)
- March (4)
- February (4)
- January (8)
- 2009
- December (4)
- November (3)
- October (4)
- September (5)
- August (1)
- July (2)
- June (2)
- April (1)
- March (1)
- February (2)
- January (1)
- 2008
- My blog
- Post new blog entry
- All blogs
Run 9 W/Z Cross Section Paper Proposal Page
Title:
PAs: Jan Balewski, Ross Corliss, Joe Seele, Justin Stevens*, Bernd Surrow, Gene Van Buren, Scott Wissink* (* = Writing team)
Proposed Target Journal: Physical Review D
Paper Drafts:
Version 1.6: pdf tar (color pdf)
Version 1.7: pdf tar (color pdf)
Version 1.8: pdf tar (color pdf)
Version 1.9: color pdf tar (submitted to PRD 12/13/11)
Version 2.0: color pdf tar (text markup version: blue=new text and red=remove text)
STAR Notes: #546: Analysis Technical Note: pdf
#533: Vernier scan analysis documentation: pdf
Presentations:
Paper Proposal (Davis Analysis Meeting 8/25/11)
PWGC Paper Preview (PWGC Meeting 9/6/11)
GPC Discussion:
- 1st Meeting (10/6/11) Minutes
- 2nd Meeting (10/20/11) No minutes
- 3rd Meeting (10/27/11) Minutes
- Background study from QCD MC
- GPC comments to Version 1.3 and 1.4 and PA response (All incorporated in Version 1.5)
- 4th Meeting (11/3/11) Minutes
- GPC English QA: Janet
- PA response to final comments (All incorporated in Version 1.6)
Collaboration Review Comments and PA response (all incorporated in Version 1.7):
- Carl
- Argonne
- Old Dominion Univ.
- Shandong Univ.
- Czech Tech. Univ.
- Xin (included in Version 1.8)
- Norbert (included in Version 1.9)
PRD Review:
- General comments from referee (e-mail)
- Detailed wording suggestions from referee (pdf file)
- Resubmitted version (v2.0) and responses to referee comments (note to starpapers)
Abstract:
We report measurements of the charge-separated \WpmDtoenu\ and \Zgtoee\ production cross sections at mid-rapidity in proton-proton collisions at \sqrts\ = 500~GeV. These results are based on 13.2~\invpb\ of data recorded in 2009 by the STAR detector at RHIC. Production cross sections for \Wvar\ bosons that decay via the $e \nu$ channel were measured to be $\sigma(pp \to \Wpl X) \cdot \BR(\Wptoenu)$ = 117.3 $\pm$ 5.9(stat) $\pm$ 6.2(syst) $\pm$ 15.2(lumi)~pb, and $\sigma(pp \to \Wmi X) \cdot \BR(\Wmtoenu)$ = 43.3 $\pm$ 4.6(stat) $\pm$ 3.4(syst) $\pm$ 5.6(lumi)~pb. For \Zgam\ production, $\sigma(pp \to \Zgam \, X) \cdot \BR(\Zgtoee)$ = 7.7 $\pm$ 2.1(stat) $^{+0.5}_{-0.9}$(syst) $\pm$ 1.0(lumi)~pb was measured for di-lepton invariant masses \mee\ between 70 and 110~\GeVcc. First measurements of the \Wvar\ cross section ratio, $\sigma(pp \to \Wpl X) / \sigma(pp \to \Wmi X)$, at \sqrts\ = 500~GeV are also reported. Theoretical predictions, calculated using recent parton distribution functions, are found to agree with the measured cross sections.
Figures with captions:
Figure 1:
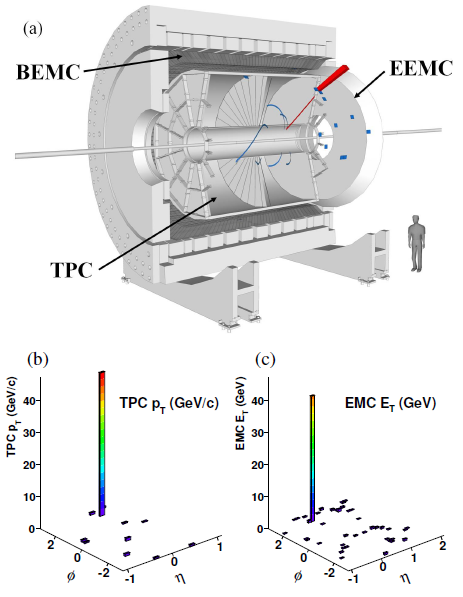
(a) W candidate event display embedded in a schematic of the STAR detector. Descriptions of the subsystems relevant for this analysis are given in section II. (b) TPC $p_T$ and (c) BEMC and EEMC $E_T$ distributions in $\eta$ and $\phi$ for the same W candidate as shown in (a).
Figure 2:
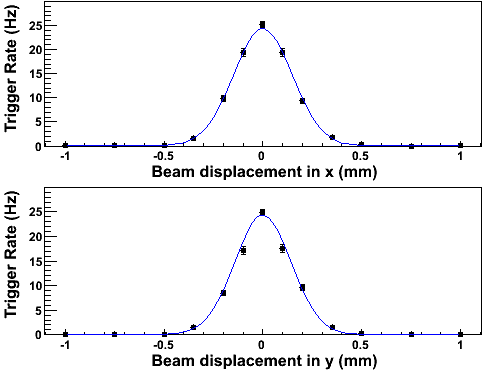
Trigger rate as a function of vernier scan displacement in the x and y directions. The transverse beam widths ($\sigma_x$ and $\sigma_y$) and maximum trigger rate ($R^{max}_{ver}$) are extracted from the fit, which is superimposed.
Figure 3:
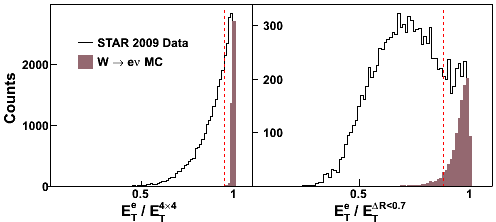
Distributions of the $E^e_T/E_T^{4x4}$ (left) and $E^e_T/E_T^{\Delta R < 0.7}$ (right) used in $e^{\pm}$ candidate selection. $W \rightarrow e \nu$ MC shape distributions (arbitrary normalization) are shown as filled histograms for comparison with the data distributions. The vertical dashed lines indicate the placements of the cuts on these isolation ratios.
Figure 4: (print version)

Correlation of signed $P_T$-balance variable and $E^e_T$ for data (left) and $W \rightarrow e \nu$ MC (right).
Figure 5:
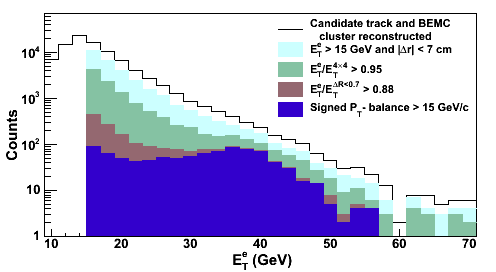
Distributions of the $E^e_T$ for W candidate events after sequentially applying the selection criteria described in sections IV A and IV B.
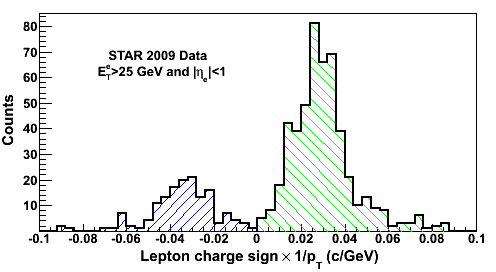
Distributions of the product of the TPC reconstructed charge sign and $1/p_T$ for candidates satisfying all the W signal selection criteria and $E_T^e > 25$~GeV.
Figure 7:
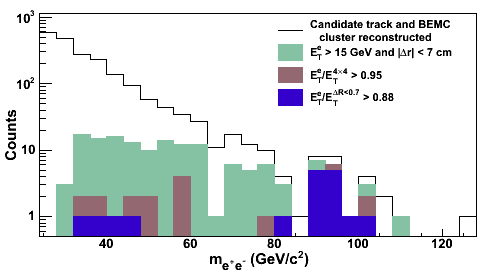
Distributions of the invariant mass of pairs of oppositely charged $e^{\pm}$ candidates after sequentially applying the selection criteria described in section IV A to both $e^{\pm}$ candidates.
Figure 8:
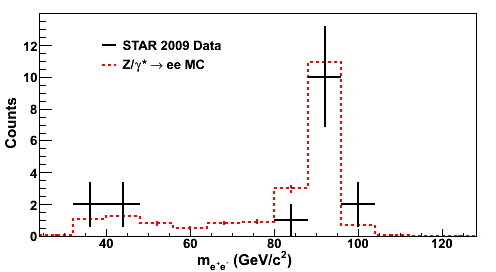
Distributions of the invariant mass of $Z/\gamma^* \rightarrow e^+ e^-$ candidate events satisfying all selection criteria described in section IV C. The $Z/\gamma^* \rightarrow e^+ e^-$ MC distribution (dashed line) is shown for comparison.
Figure 9:
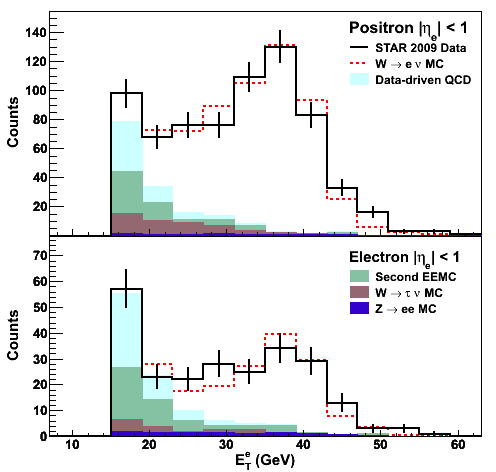
$E^e_T$ distribution of $W^+$ (top) and $W^{-}$ (bottom) candidate events, background components, and $W \rightarrow e \nu$ MC signal for comparison. Note the factor of two difference in the vertical scales.
Figure 10:
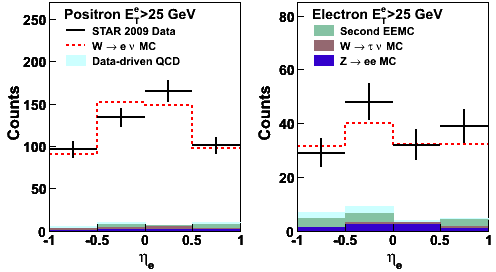
Lepton pseudorapidity distribution of $W^+$ (left) and $W^{-}$ (right) candidate events, background components, and $W \rightarrow e \nu$ MC signal for comparison.
Figure 11:

Measurements of W and $Z/\gamma^*$ ($70<m_ee<110 GeV/c^2$) total cross sections times branching ratio versus center-of-mass energy. For the W cross sections in pp collisions, the closed symbols represent W+ and the open symbols represent W-. The theory curves are from the FEWZ program at NLO using the MSTW08 PDF set.
Figure 12:
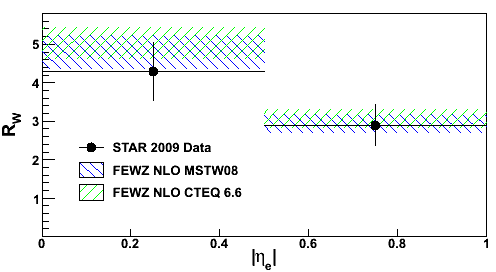
W cross section ratio, $R_W$, for the two $e^{\pm}$ pseudorapidity bins. Theory calculations at NLO from the FEWZ program using the MSTW08 and CTEQ 6.6 PDF sets (with 90% confidence level error eigenvector uncertainties) are shown for comparison.
Summary:
We have presented measurements of the \Wptoenu\ and \Wmtoenu\ production cross sections in proton-proton collisions at $\sqrts = 500~\GeV$ by the \STAR\ detector at \RHIC. A first measurement of the \Zgtoee\ production cross section at $\sqrts = 500~\GeV$ is also presented. Theoretical predictions based on pQCD calculations are in good agreement with the measured cross sections. In addition, a first measurement of the \Wvar\ cross section ratio is presented. Future high statistics measurements of the \Wvar\ cross section ratio at RHIC will provide a new means of studying the flavor asymmetry of the antiquark sea which is complementary to fixed-target Drell-Yan and LHC collider measurements.
- stevens4's blog
- Login or register to post comments
