- stevens4's home page
- Posts
- 2014
- 2013
- 2012
- 2011
- December (1)
- November (2)
- October (1)
- September (1)
- August (2)
- July (3)
- June (7)
- May (2)
- April (2)
- March (5)
- February (2)
- January (2)
- 2010
- November (1)
- October (1)
- September (3)
- August (3)
- July (3)
- June (1)
- May (1)
- April (3)
- March (4)
- February (4)
- January (8)
- 2009
- December (4)
- November (3)
- October (4)
- September (5)
- August (1)
- July (2)
- June (2)
- April (1)
- March (1)
- February (2)
- January (1)
- 2008
- My blog
- Post new blog entry
- All blogs
ZDC rate dependence of W efficiency
ZDC rate dependence of W efficiency
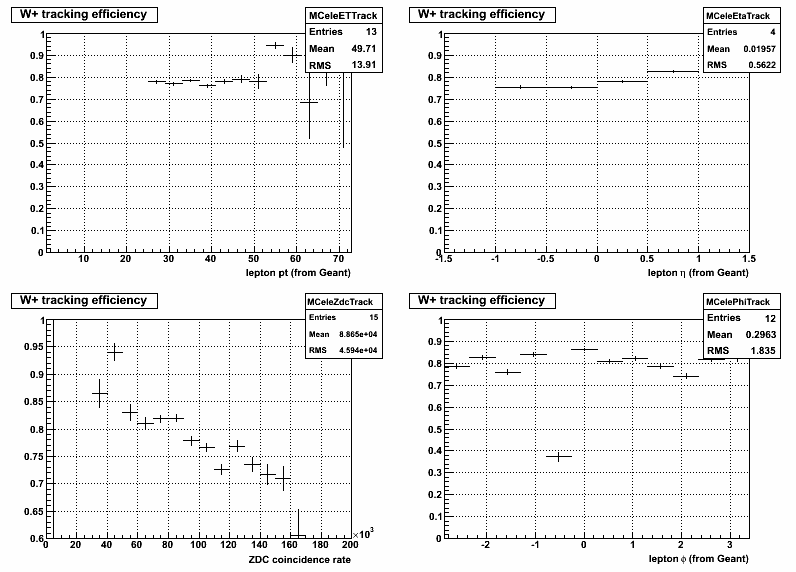
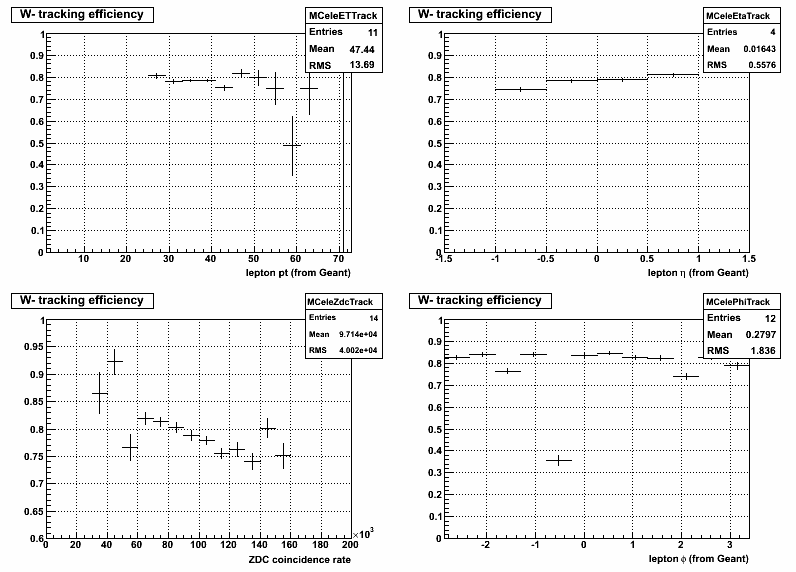
In a previous blog post I separated the embedding and data by the 2 time periods with different inner TPC anode HV. These two periods happen to be very correlated with the different instantaneous luminosities (ie. ZDCX rates). Below is a study of the different ZDCX rates on the W reconstruction efficiency. The conclusion is that the efficiency has a ZDC rate dependence, and there is little (if any) change in efficiency due to TPC anode HV changes.
Embedding efficiency:
| ZDCX rate (kHz) | Inner Anode TPC HV | W+ vertex effic | W+ track effic | W+ total effic |
| 0-100 | 1170 | 0.900 +/- 0.014 | 0.815 +/- 0.011 | 0.590 +/- 0.014 |
| 1135 | 0.894 +/- 0.010 | 0.801 +/- 0.011 | 0.575 +/- 0.012 | |
| Both HV values included | 0.897 +/- 0.008 | 0.808 +/- 0.008 | 0.583 +/- 0.009 | |
| 100-160 | 1170 | 0.855 +/- 0.027 | 0.759 +/- 0.028 | 0.478 +/- 0.029 |
| 1135 | 0.873 +/- 0.007 | 0.743 +/- 0.008 | 0.515 +/- 0.009 | |
| Both HV values included | 0.871 +/- 0.007 | 0.744 +/- 0.008 | 0.512 +/- 0.008 | |
| Ratio (low/high rate) | Both HV values included | 1.030 +/- 0.012 | 1.086 +/- 0.016 | 1.14 +/- 0.025 |
Figure 1: W+ Tracking efficiency (ZDC rate dependence in lower left)

Figure 2: W- Tracking efficiency (ZDC rate dependence in lower left)

Data:
To estimate the difference in efficiency ratio between the two ZDC rate samples calculate the x-section multiplied by the efficiency as
Since the x-section is a constant the ratio of sigma*epsilon is the ratio of the efficiencies.
| ZDCX rate | N_raw | N_bkgd | L | N_raw/L | N_bkgd/L | sigma*epsilon |
| 0-100 | 242 | 27 | 5.7 | 42.2 +/- 2.7 | 4.7 | 37.5 +/- 2.4 |
| 100-160 | 263 | 34 | 7.5 | 35.1 +/- 2.2 | 4.5 | 30.5 +/- 1.9 |
| Ratio (low/high rate) | 0.92 | 0.79 | 0.76 | 1.20 +/- 0.10 | 1.04 | 1.23 +/- 0.11 |
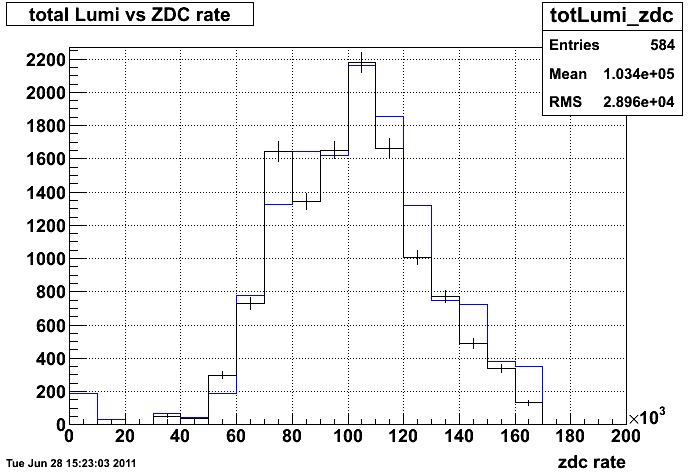
Figure 3: Integrated Luminosity (blue) and ZB events from embedding (black) vs ZDC rate

Summary:
1) There is a significant luminosity dependence to the tracking and vertex efficiencies seen in the embedding samples (which I hadn't fully appreciated before). Note: Within the same range of ZDC rate the different inner anode HV doesn't seem to change the efficiencies.
2) The ratio of sigma*epsilon from the data shows a larger variation in efficiency in the data than the embedding, but the conclusion is limited by statistics in the data.
3) The sample of ZB events for the embedding was selected to roughly sample the same ZDC rate as the data to approximately average over these rate dependent effects. Although In figure 3 it is clear that the higher ZDC rate is undersampled in the embedding, which needs to be corrected. This should lower the average efficiency by a couple percent. (One alternative would be to bin the W yield by ZDC rate and apply a ZDC rate dependent efficiency correction to calculate the cross section, but this requires estimating the background separately for each ZDC rate bin.)
- stevens4's blog
- Login or register to post comments
