- stevens4's home page
- Posts
- 2014
- 2013
- 2012
- 2011
- December (1)
- November (2)
- October (1)
- September (1)
- August (2)
- July (3)
- June (7)
- May (2)
- April (2)
- March (5)
- February (2)
- January (2)
- 2010
- November (1)
- October (1)
- September (3)
- August (3)
- July (3)
- June (1)
- May (1)
- April (3)
- March (4)
- February (4)
- January (8)
- 2009
- December (4)
- November (3)
- October (4)
- September (5)
- August (1)
- July (2)
- June (2)
- April (1)
- March (1)
- February (2)
- January (1)
- 2008
- My blog
- Post new blog entry
- All blogs
EEMC electrons: Run 6 vs Run 9 (more stats)
EEMC electrons: Run 6 vs Run 9 (more stats)
A few months ago I took a first look at reconstructing electrons in the EEMC in Run 9 data. The yield in Run 9 was significantly reduced when comparing to a similar number of events from Run 6, so the initial conclusion was that with the material upstream of the endcap (SVT) being removed between Run 6 and Run 9 the number of conversion electrons was significanlty reduced. In the study presented here I've looked at the full Run 9 dataset (Pibero's jet list) aside from the runs where the ESMD TCD phase was set incorrectly. Despite the removal of the upstream material the electron yield in Run 9 still appears sizeable, however the hadronic background is much larger (relative to the electron peak) compared to Run 6.
Notes:
1) The ETOW gains used for Run 6 are the final values from the study found here, and the gains used for the Run 9 data are the gains from Run 6 modified for the HV change at the end of Run 7.
2) In the figures below the left column is Run 6 data and the right column is Run 9 data.
The first cuts used to generate the trees are:
- |Vertex Z| < 120 cm
- vertex rank > 0
- Track nFit/nPoss > 0.51
- Track eta > 0.3
- Track points to front of EEMC tower
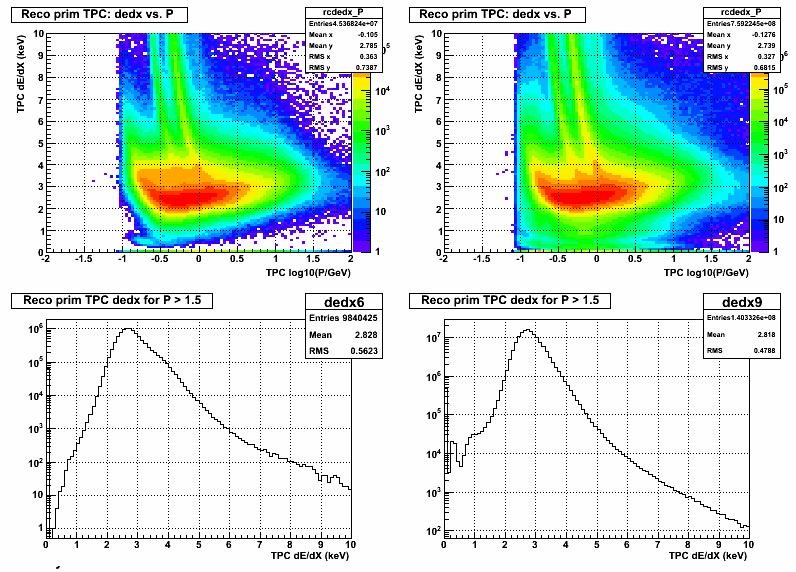
Figure 1: dE/dx vs P (upper row) and dE/dx for P > 1.5 (lower row) after the inital cuts given above
Here are some track cuts applied to select candidates useful for calibration (isolation, etc.). The results after these cuts are applied are shown in Figure 2:
- Track enters and exits same tower
- Track is 2 cm from tower edge
- Track p > 1.0 GeV
- No tower in 3x3 cluster has more than 0.5 * central tower energy
- No other tracks point to 3x3 cluster
Figure 2: dE/dx vs E/P (upper row) and E/p for dE/dx = [3.5,5] (lower row) after the candidate selection cuts above, where E is the energy in the tower pointed to by the track and p is the reconstructed primary track momentum at the vertex.
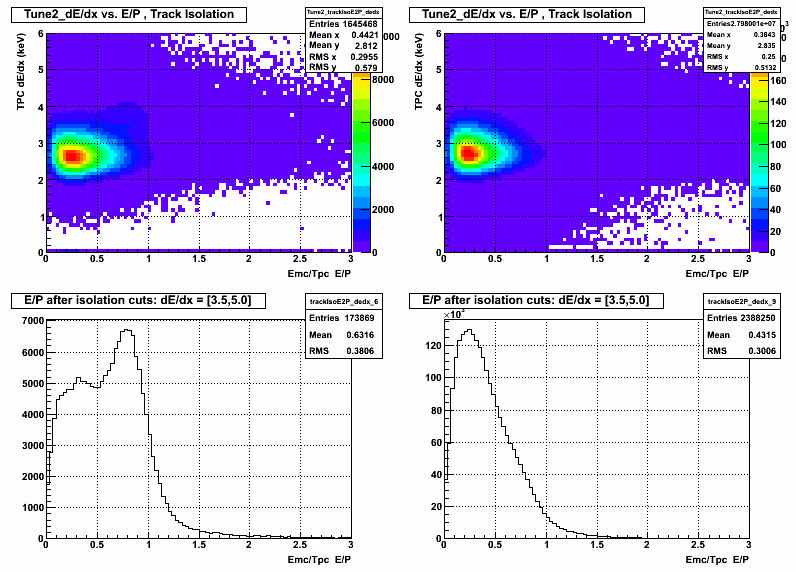
The Run 6 sample above peaks near 1 as expected for electrons, while the Run 9 sample appears to still be dominated by background. To try to enrich the sample with more electrons some further EEMC specific cuts are applied:
- Preshower 1 E > 2.0 MeV
- Preshower 2 E > 3.0 MeV
- Postshower E < 0.2 MeV
- Pre 2 / Pre 1 > 1
- SMD E / Tower E > 10 (MeV/GeV)
- SMD nStrips fired (U+V) > 20
- SMD U and V RMS > 0.3 strips
The cuts above were selected by looking at each of the variables above in 2 dE/dx bins ( "background": dE/dx=[0,3] (red histograms in links below) and "electron-like": dE/dx=[3.5,5] (black histograms in links below)). The plots of these quantities are shown in the pdfs attched for Run 6 and Run 9. In the Run 6 data there are clearly more electrons in the "electron-like" sample, so they are used to tune the cuts.
The dE/dx vs E/p plots after each cut are shown in this pdf file. In the Run 6 plots (left column) you can see the background (dE/dx < 3) shrinking relative to the electron yield (dE/dx=[3.5,5]) after each cut. The Run 9 plots are obviously dominated by background until the last few cuts where an electron peak begins to appear. Figure 3 below shows the E/p distribution after all the cuts above are applied.
Figure 3: dE/dx vs E/P (upper row) and E/p for dE/dx = [3.5,5] (lower row) after all cuts are applied
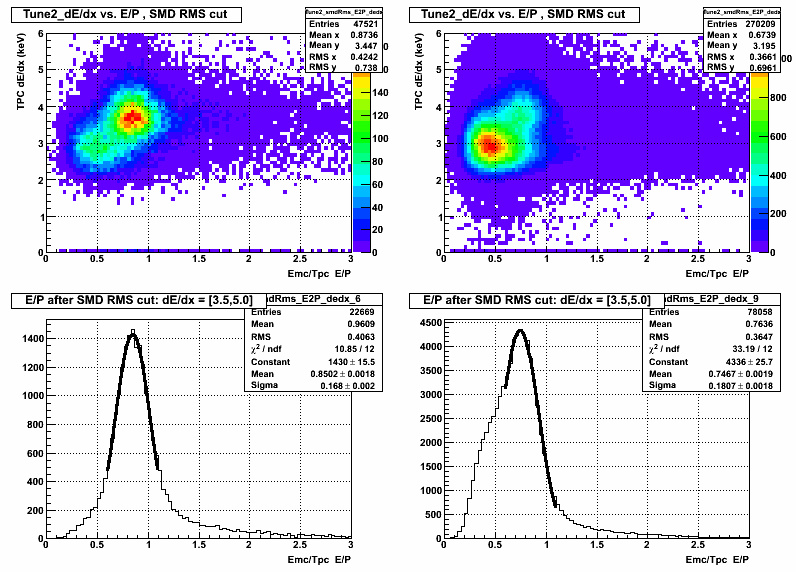
For both the Run 6 and Run 9 data the MPV of the E/p peak is less than 1. However, the energy in this E/p ratio is simply the energy in the single tower pointed to by the track, and no correction has been made for energy leaking outside that tower.
Also the background clearly is larger in Run 9, and will need to understood further. Figure 4 shows an E/p "background shape" obtained from candidates in the background region in dE/dx=[0,3]. To parameterize the background I fit it with a Landau which obviously isn't quite correct, but it doesn't do so bad.
Figure 4: dE/dx vs E/P (upper row) and E/p for dE/dx = [0,3] (lower row) after all cuts are applied
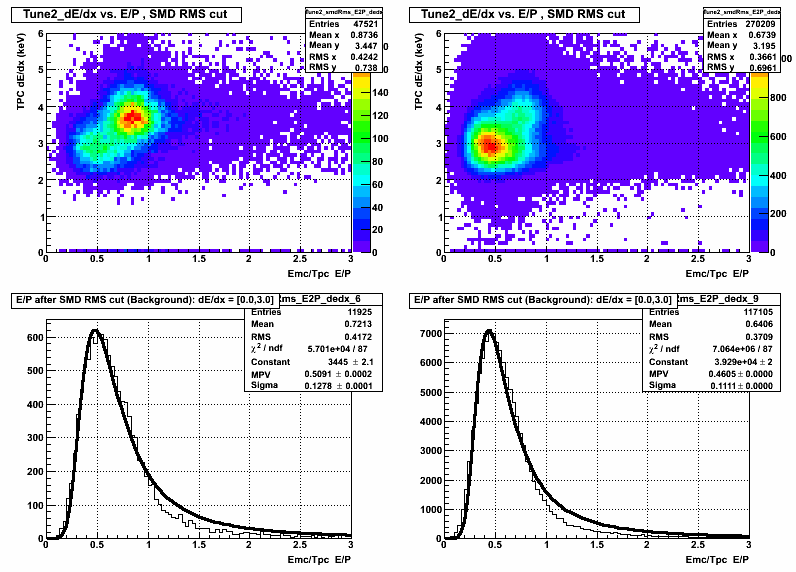
To be able to fit the electrons in the E/p spectrum I'm fitting a Landau+Gaussian to the E/p distributions shown in Figure 3, with the MPV and Width of the Landau fixed to the parameters of determined from the "background shape" in Figure 4. The Landau amplitude and all the Gaussian parameters are allowed to float. The result of the fits are seen in Figure 5.
Figure 5: dE/dx vs E/P (upper row) and E/p for dE/dx = [3.5,5] (lower row) after all cuts applied and fitting background and signal with a Landau+Gaussian.
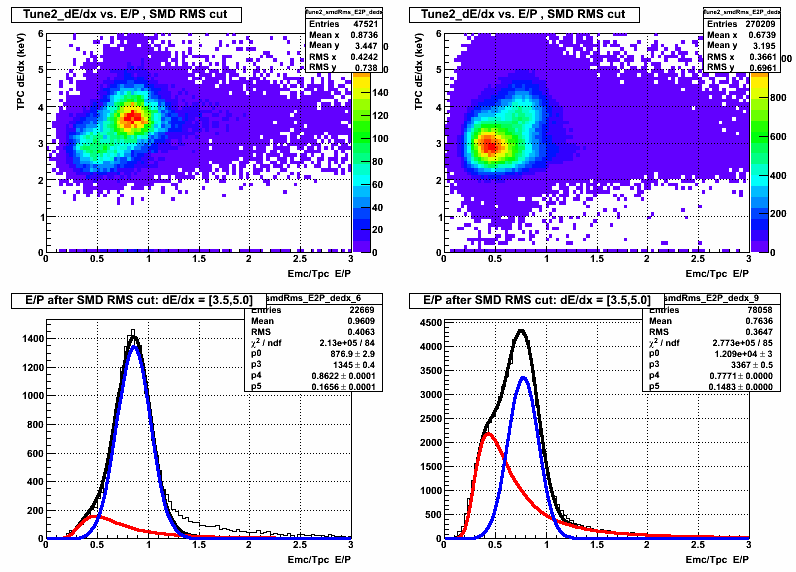
The fits aren't great (especially for Run 6), but the main feature of interest is the centroid of the Gaussian, which can be used to determine the gain of the towers if one can come up with a robust background subtraction procedure. Taking the centroids at face value in Figure 5 (Run 6 E/p=0.88 and Run 9 E/p=0.78) indicates again that the gains are lower than expected in Run 9 by something like ~10%, similar to what is seen in the pion analysis. Further study is necessary to determine if this method can be used to improve our understanding of the ETOW gains in Run 9 and in the future.
- stevens4's blog
- Login or register to post comments
