- stevens4's home page
- Posts
- 2014
- 2013
- 2012
- 2011
- December (1)
- November (2)
- October (1)
- September (1)
- August (2)
- July (3)
- June (7)
- May (2)
- April (2)
- March (5)
- February (2)
- January (2)
- 2010
- November (1)
- October (1)
- September (3)
- August (3)
- July (3)
- June (1)
- May (1)
- April (3)
- March (4)
- February (4)
- January (8)
- 2009
- December (4)
- November (3)
- October (4)
- September (5)
- August (1)
- July (2)
- June (2)
- April (1)
- March (1)
- February (2)
- January (1)
- 2008
- My blog
- Post new blog entry
- All blogs
Investigating Run 9 ETOW gains
Investigating Run 9 ETOW gains
The Valpo group provided me with a set of preliminary gain values to do some simple comparisons to the gains we expected in Run 9. These expected gains are the gains measured in Run 6 adjusted based on the ratio of slopes actually measured at the very end of run 7 due to the changes made to the tower HV. Previous investigations have found an overall lower gain of ~7% based on MIPS and pi0s in Run 9 than what was expected. This study was aimed at checking the level of tower-to-tower fluctuations in this gain shift and any crate or eta dependence.
Two pdfs attached below show the ratio of Valpo gains to the Run 6 HV corrected gains in etabins and sectors. The left plot on each page is the gain ratio for each tower in that etabin or sector, and the right plot is the distribution of these gain ratios.
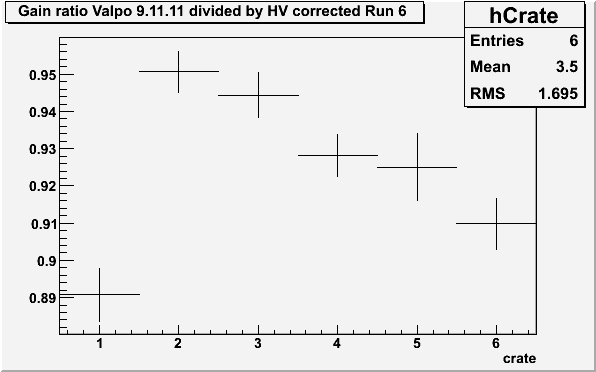
The gain ratio is plotted vs crate shown in figure 1 below. There appears to be a crate dependence that is ~linear with crate number. Since this is a ratio it is important to know whether the numerator or the denominator (or both) contains this crate dependence. Here are plots of the average gain as a function of crate number for the Valpo gains and the Run 6 HV corrected gains. The gains from the Valpo group clearly contain the crate dependence, indicating that the lower gain in Run 9 may be crate dependent.
Figure 1: Mean gain ratio as a function of crate number
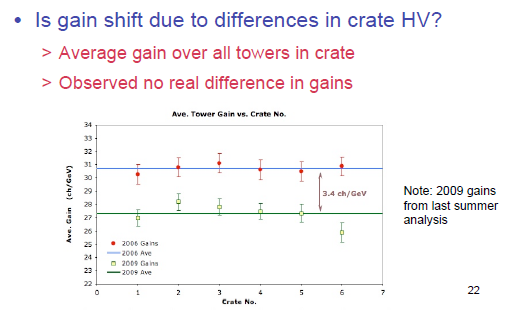
I dug around some of the old presentations by ANL/Valpo looking for plots of sector or crate dependence. The only plot I could find is from Dave Grosnick's presentation from 8/16/11 (slide 22), showing the average gain for each crate. I'm not sure what gains are actually used here (note about "gains from last summer analysis"?), but I believe they are different from the gains given to me by the Valpo group used for the rest of the plots on this page.
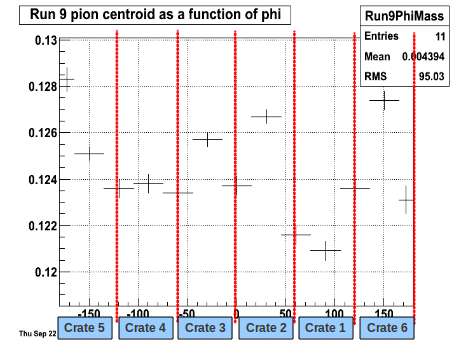
Here is a link to Nick's pion mass ratios (now binned by sector), and I added the crate labels to the Run 9 plot in figure 2 below. You can also find each bins invariant mass distribution with the fit at another one of Nick's links. There is some change in the background and signal amplitudes with phi.
Figure 2: Run 9 pi0 mass centroid provided by Nick (crate labels added)
The mean value of the gain ratio as a function of etabin is shown in figure 3 below, to look at the eta dependence.
Figure 3: Mean gain ratio as a function of etabin
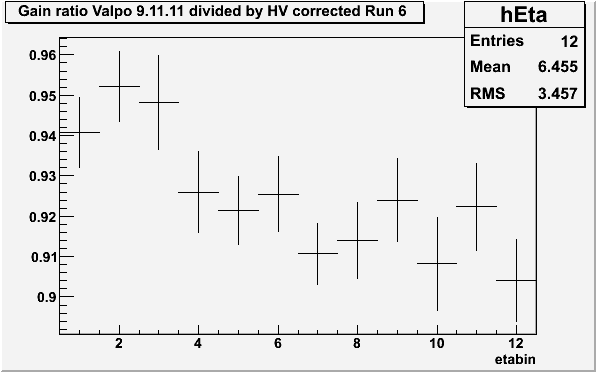
Again to check which gains in the ratio introduce the eta dependence I plotted the ratio "Valpo"/Ideal gains and "Run 6 HV corrected"/Ideal gains. The ratio Run 6 HV corrected to ideal gains is ~constant vs eta (as desired from the HV change), and the ratio of Valpo to ideal gains show a similar trend as figure 2 above.
Slopes
Another method to look at the crate dependence for a particular data set could be to look at the slopes compared between crates. Figure 4 is an example exponential fit to a tower ADC distribution using "Scott's Method" to define the fit window.
Figure 4: Example ADC distribution fit with an exponential

A "slope" (ie. exponential decay constant) is measured for each tower like the example above, where the slope is ~ 1/gain in the EEMC. The average slope in each etabin (ie. slopeEtaAvg) is found and this value is used to normalize the slopes within each eta bin. For each crate I make a distribution of the tower slope divided by the magnitude of the average slope for its etabin (seen in figure 5 for crate 1)
Figure 5: Distribution of slope/abs(slopeEtaAvg) for crate 1
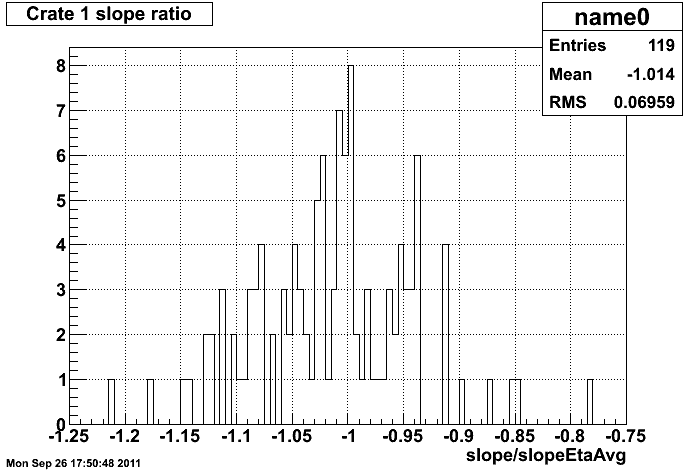
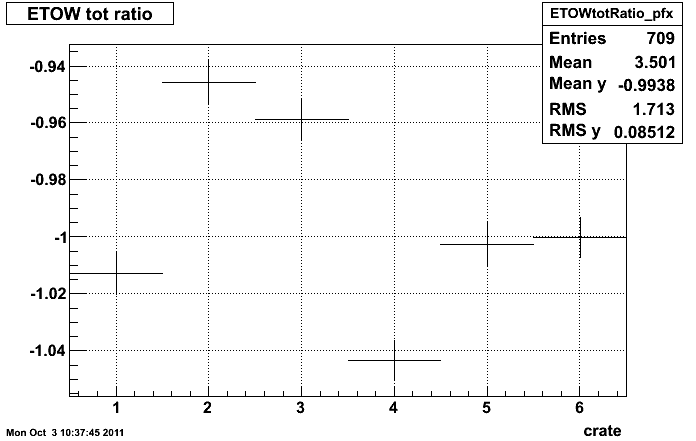
For each crate the mean of this distribution is plotted in figures 6 and 7. I chose a fill where things seemed rather stable and took a run from the beginning of the fill (R10172016) and the end of the fill (R10172028) since backgrounds should be reduced by the end of the fill. If there were no crate dependence we would expect this distribution to be constant. However, we see some crate dependence which appears similar to figure 1, with the exception of crate 4.
Figure 6: Mean value of slope/abs(slopeEtaAvg) for each crate for Run R10172016
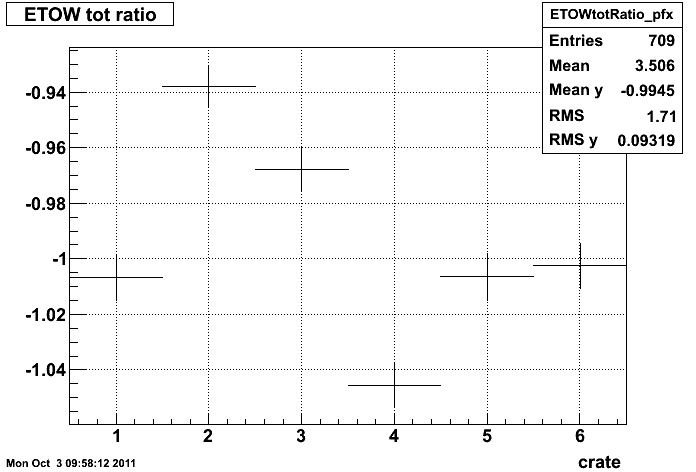
Figure 7: Mean value of slope/abs(slopeEtaAvg) for each crate for Run R10172028
- stevens4's blog
- Login or register to post comments
