- surrow's home page
- Posts
- 2024
- May (1)
- 2018
- 2017
- 2016
- 2015
- 2014
- October (3)
- September (1)
- August (1)
- July (1)
- June (3)
- May (4)
- April (6)
- March (4)
- February (5)
- January (2)
- 2013
- December (2)
- November (1)
- October (1)
- September (4)
- August (6)
- July (11)
- June (8)
- May (5)
- April (5)
- March (11)
- February (4)
- 2012
- December (3)
- November (3)
- October (3)
- September (3)
- August (3)
- July (10)
- June (9)
- May (5)
- April (4)
- March (4)
- February (7)
- January (4)
- 2011
- 2010
- December (2)
- November (4)
- August (2)
- July (3)
- June (6)
- May (4)
- April (4)
- March (8)
- February (6)
- January (4)
- 2009
- My blog
- Post new blog entry
- All blogs
pp/pA LOI delta G section on forward di-jet production
pp/pA LOI delta G section on forward di-jet production
Writeup: Version 2
Directory of Version 2 material
Directory of Version 2 figures
Writeup: Version 1
Directory of Version 1 material
Directory of Version 1 figures
Figure directories for Version 2:
- Figure 1 (pdf / jpeg / png): Detector layout
- Figure 2 (pdf / jpeg / png): Low-x coverage
- Figure 3 (pdf / jpeg / png): PDF comparison (DSSV / GRSV-STD)
- Figure 4 (pdf / jpeg / png): x1/x2 distributions Central
- Figure 5 (pdf / jpeg / png): Cross-section Central
- Figure 6 (pdf / jpeg / png): ALL Central
- Figure 7 (pdf / jpeg / png): x1/x2 distributions Forward
- Figure 8 (pdf / jpeg / png): Cross-section Forward
- Figure 9 (pdf / jpeg / png): ALL Forward
- Figure 10 (pdf / jpeg / png): Di-Jet mass correlation
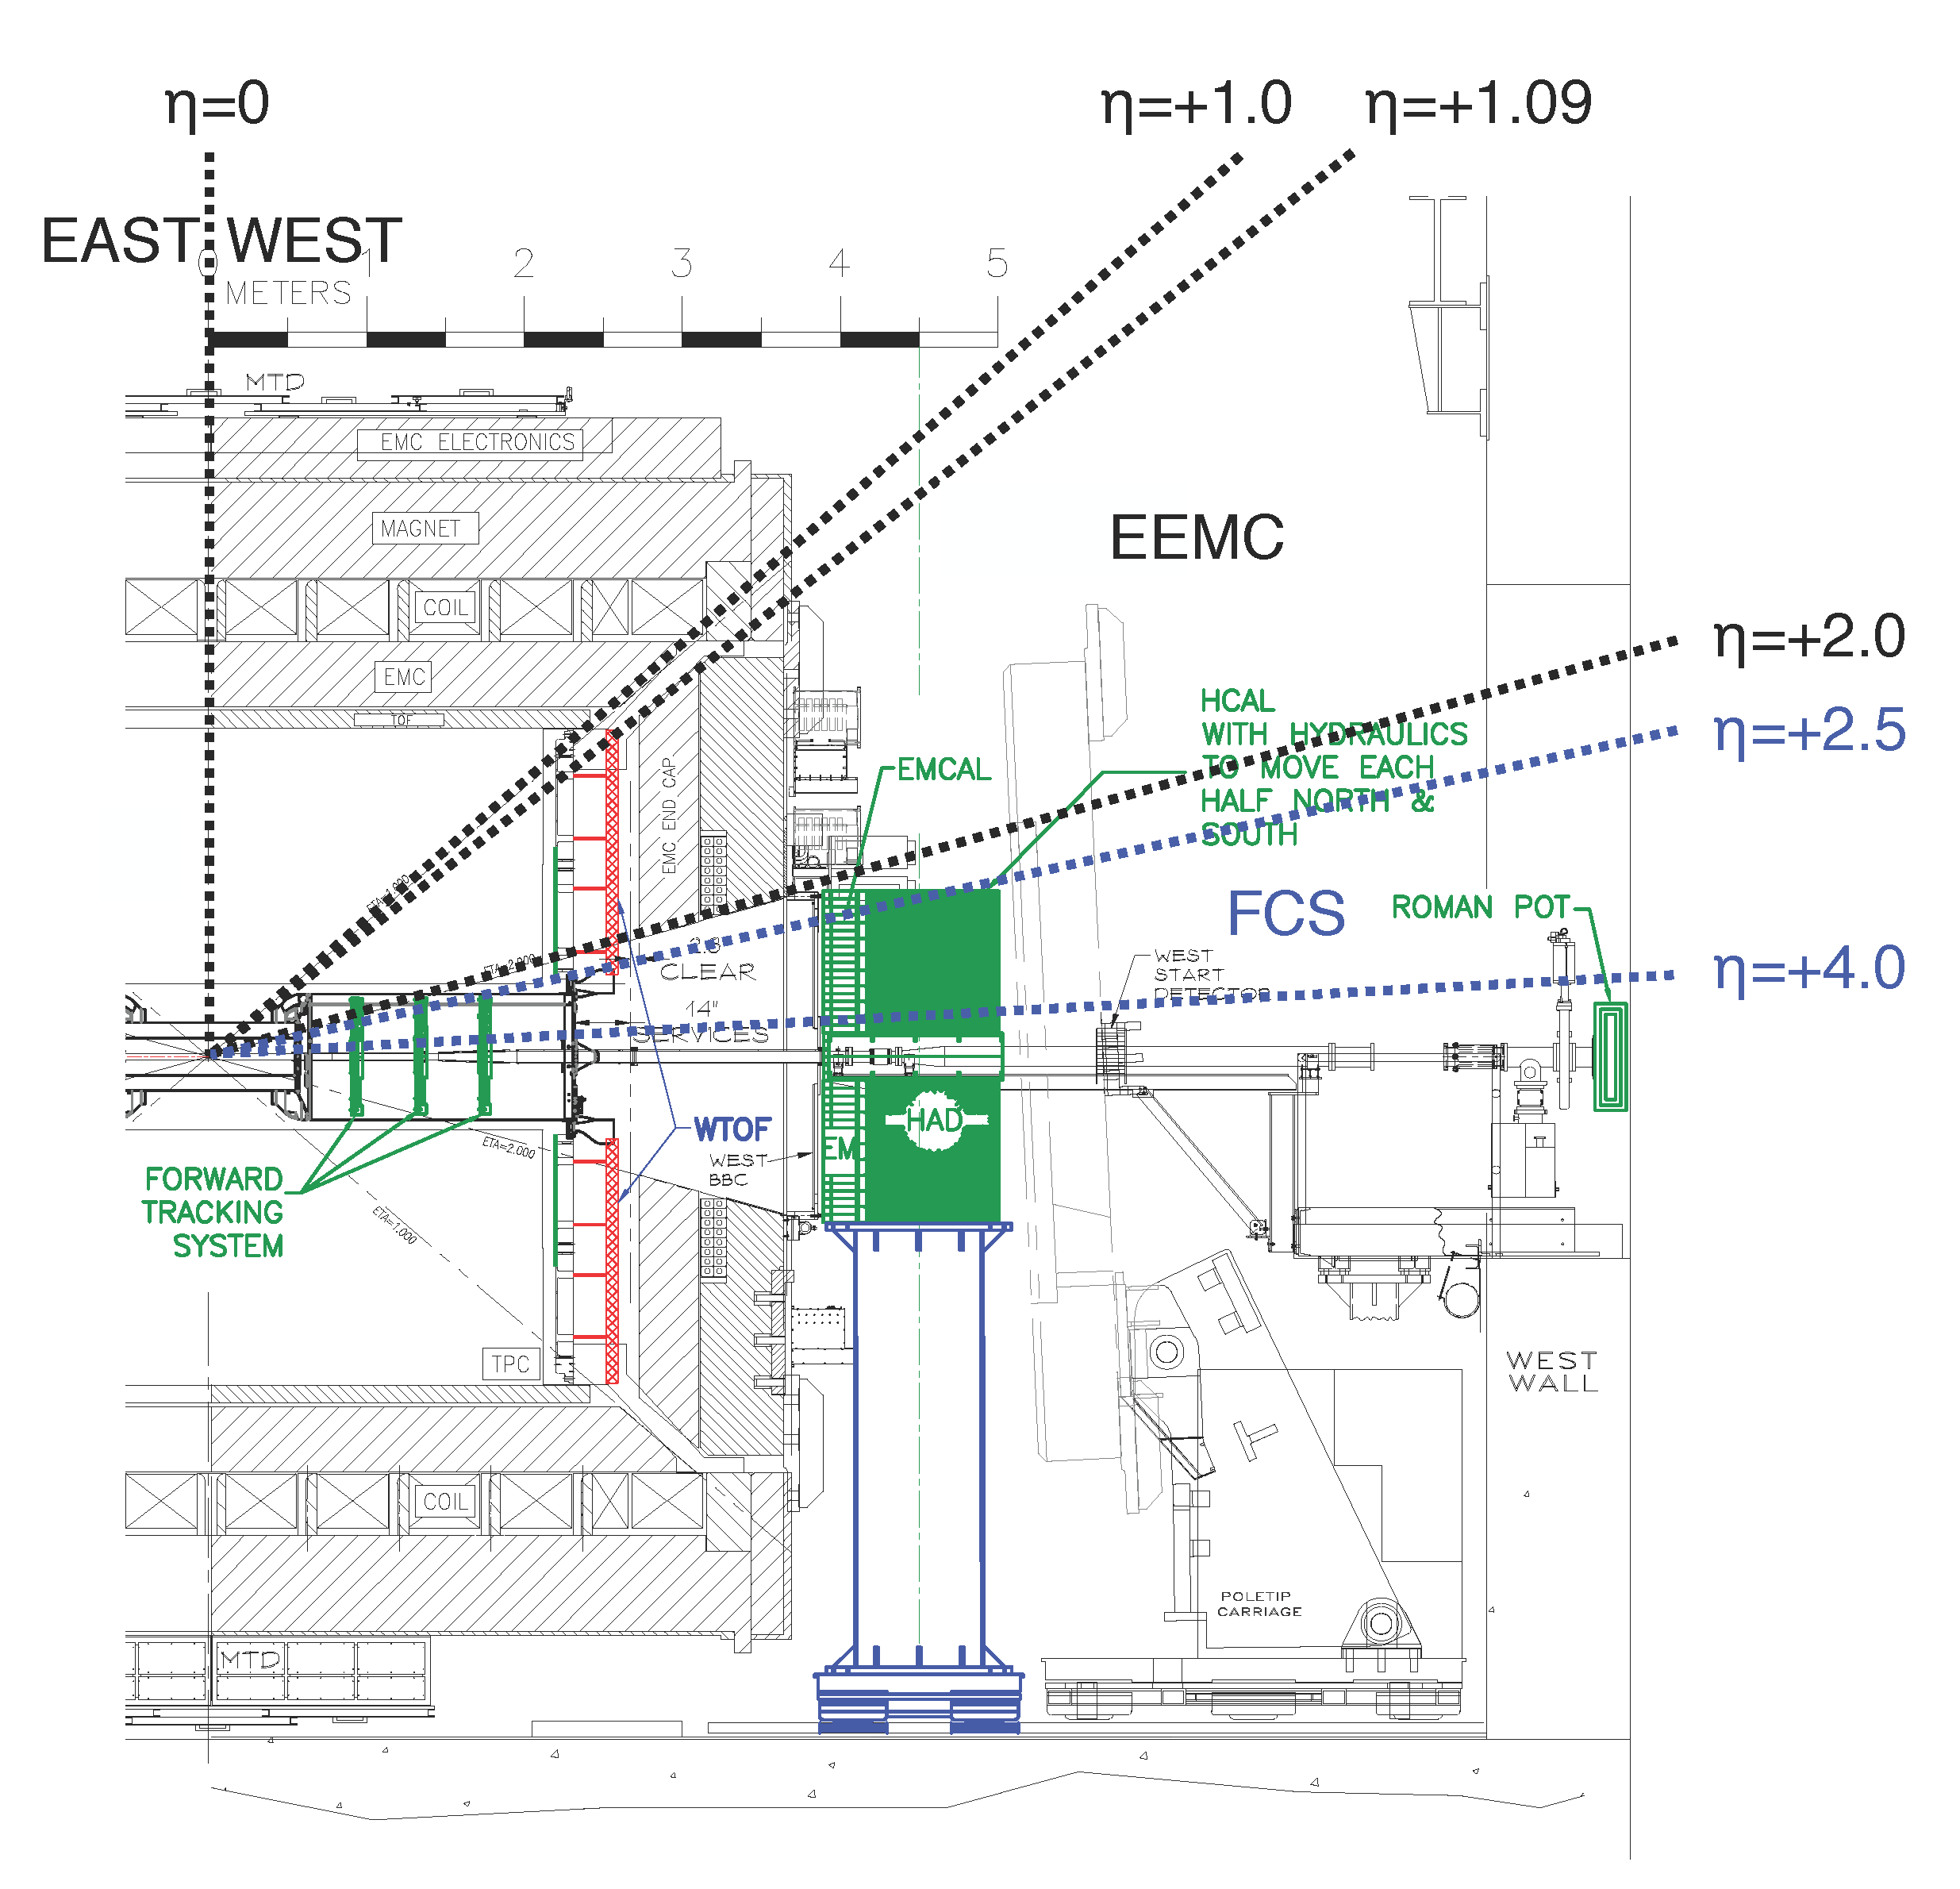
Figure 1: Layout of the forward detector upgrade configuration showing four different topological η regions: EAST (-1<η<0), WEST (0<η<1), EEMC (1.09<η<2) and FSC (2.5<η<4.0).
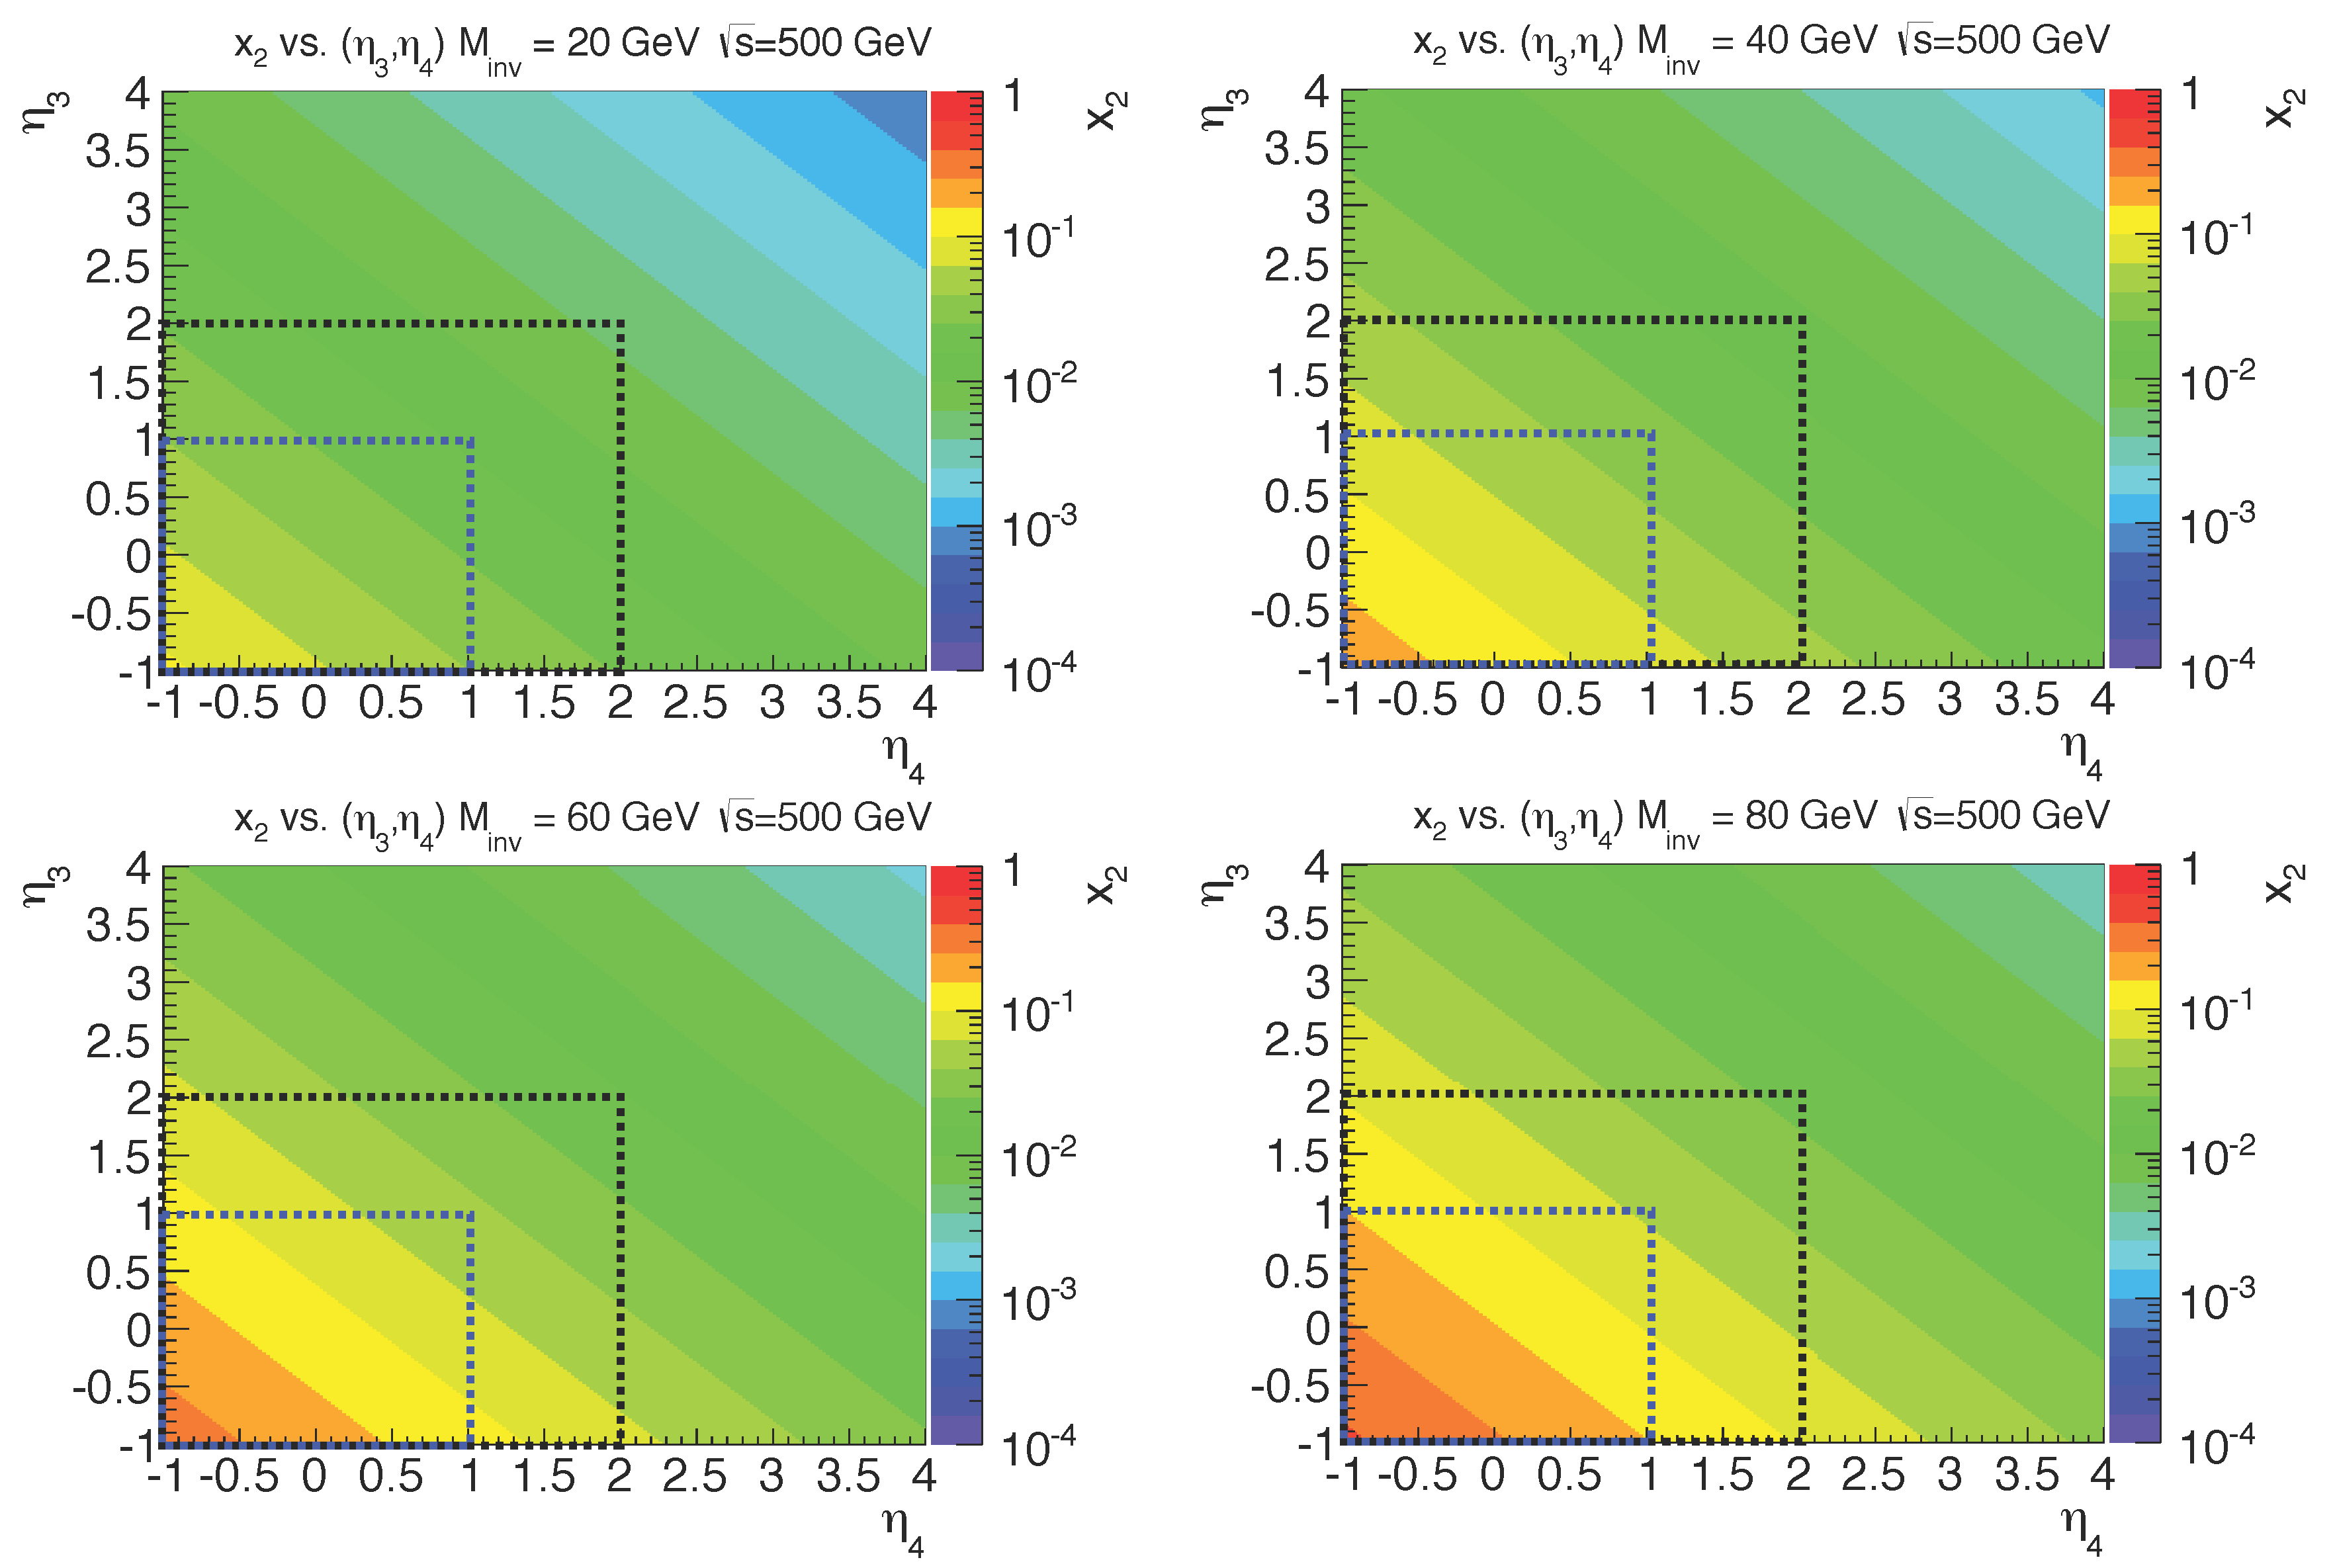
Figure 2: Low-x coverage (x2) shown as a color shade for di-jet (2-2) final states showing η3 vs. η4 for four different invariant mass values of M=20GeV, 40GeV, 60GeV and 80GeV.
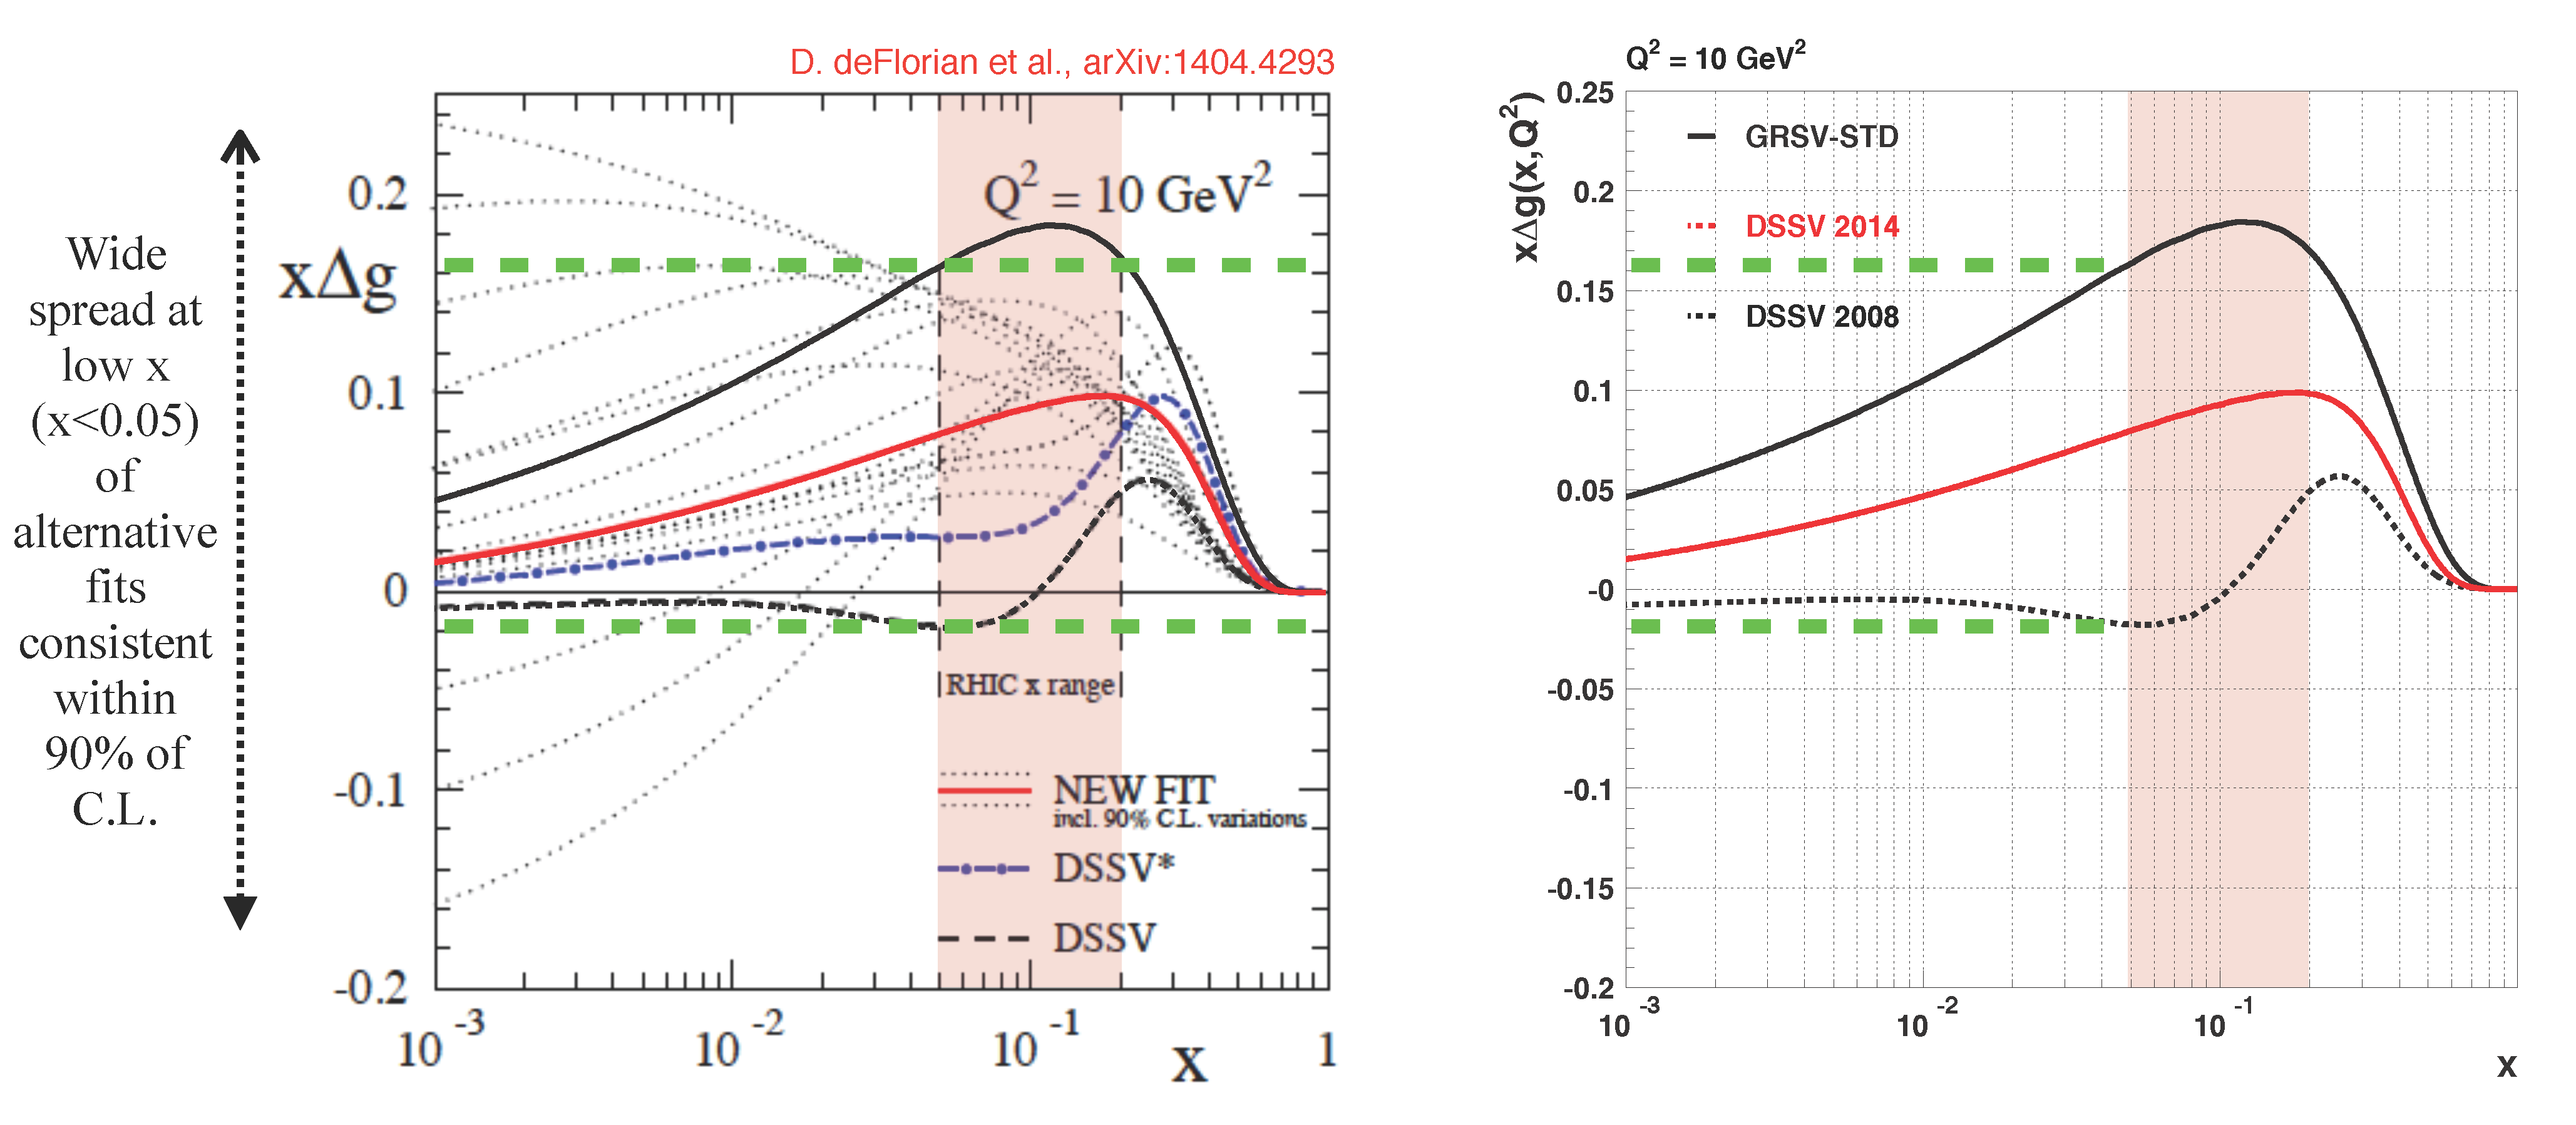
Figure 3: Polarized gluon distribution comparing DSSV (2014), DSSV (2008) and GRSV-STD.
.png)
Figure 4: x1 / x2 range for the current STAR acceptance region in η of -1 < η < 2.
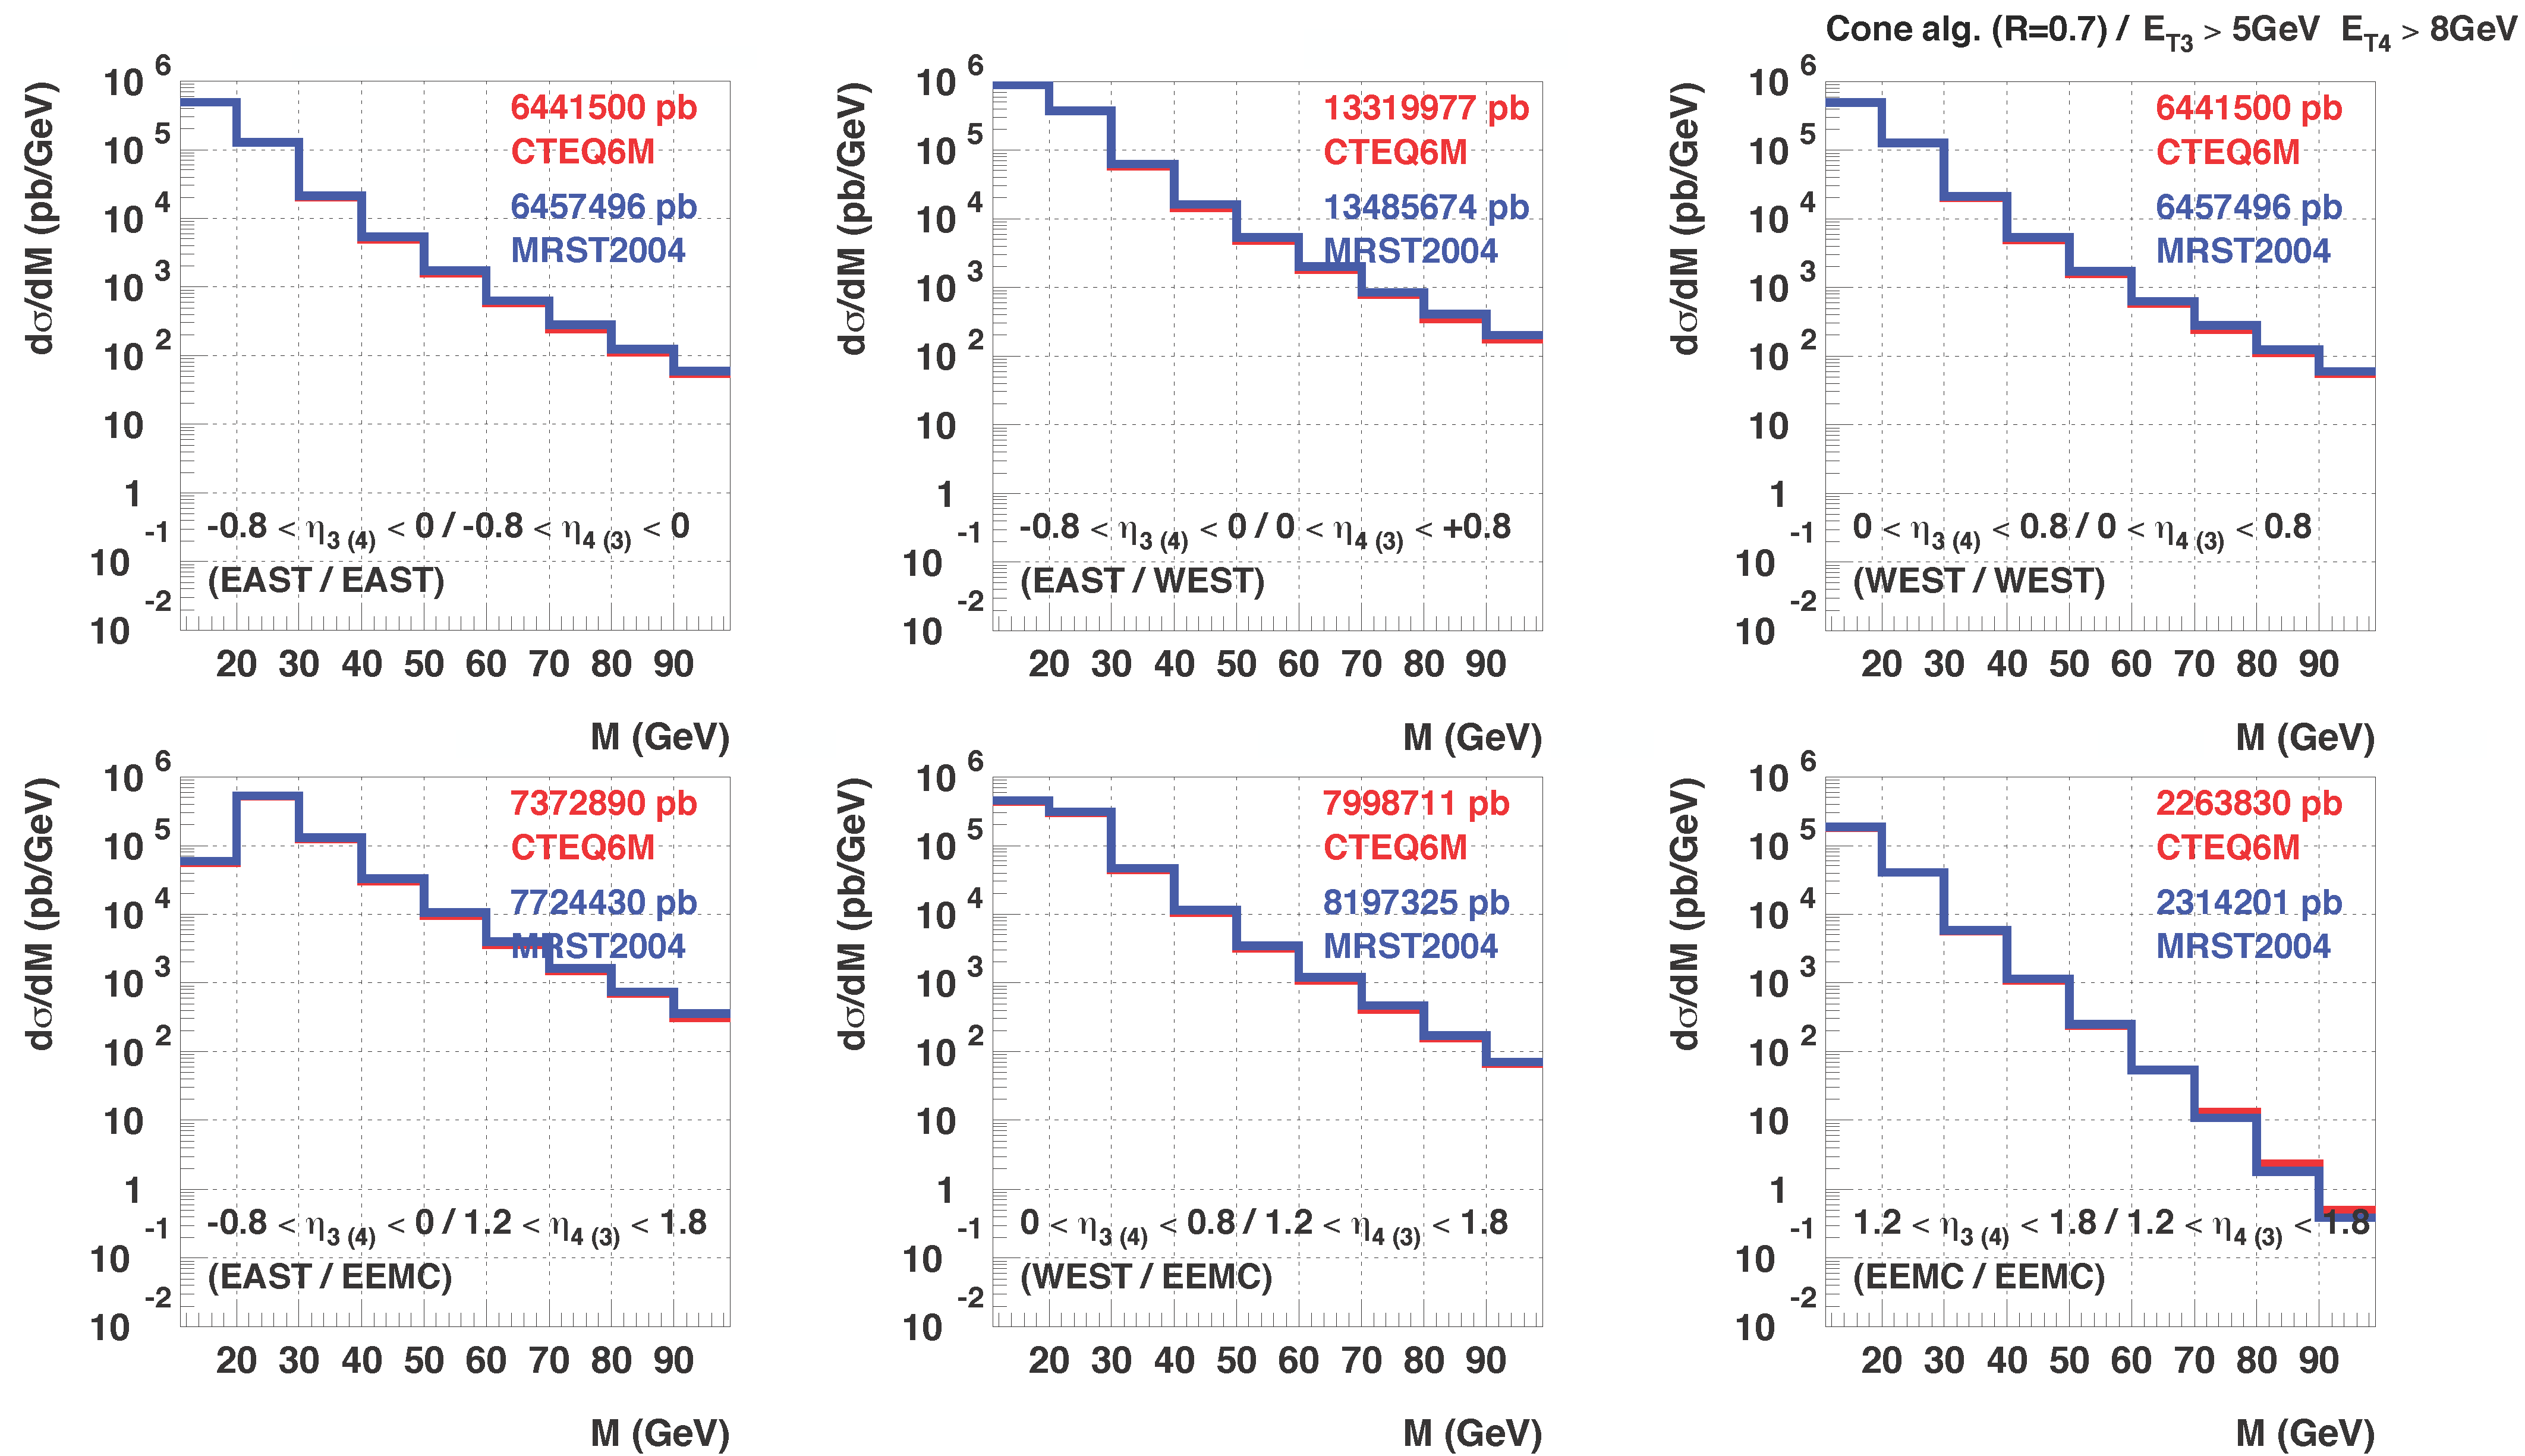
Figure 5: Invariant mass cross-section (NLO) for the current STAR acceptance region in η for -1 < η < 2.
.png)
Figure 6: ALL (NLO) for the current STAR acceptance region in η of -1 < η < 2 together with projected projected statistical and systematic uncertainties.
.png)
Figure 7: x1 / x2 range for the forward STAR acceptance region in η of 2.8 < η < 3.7.
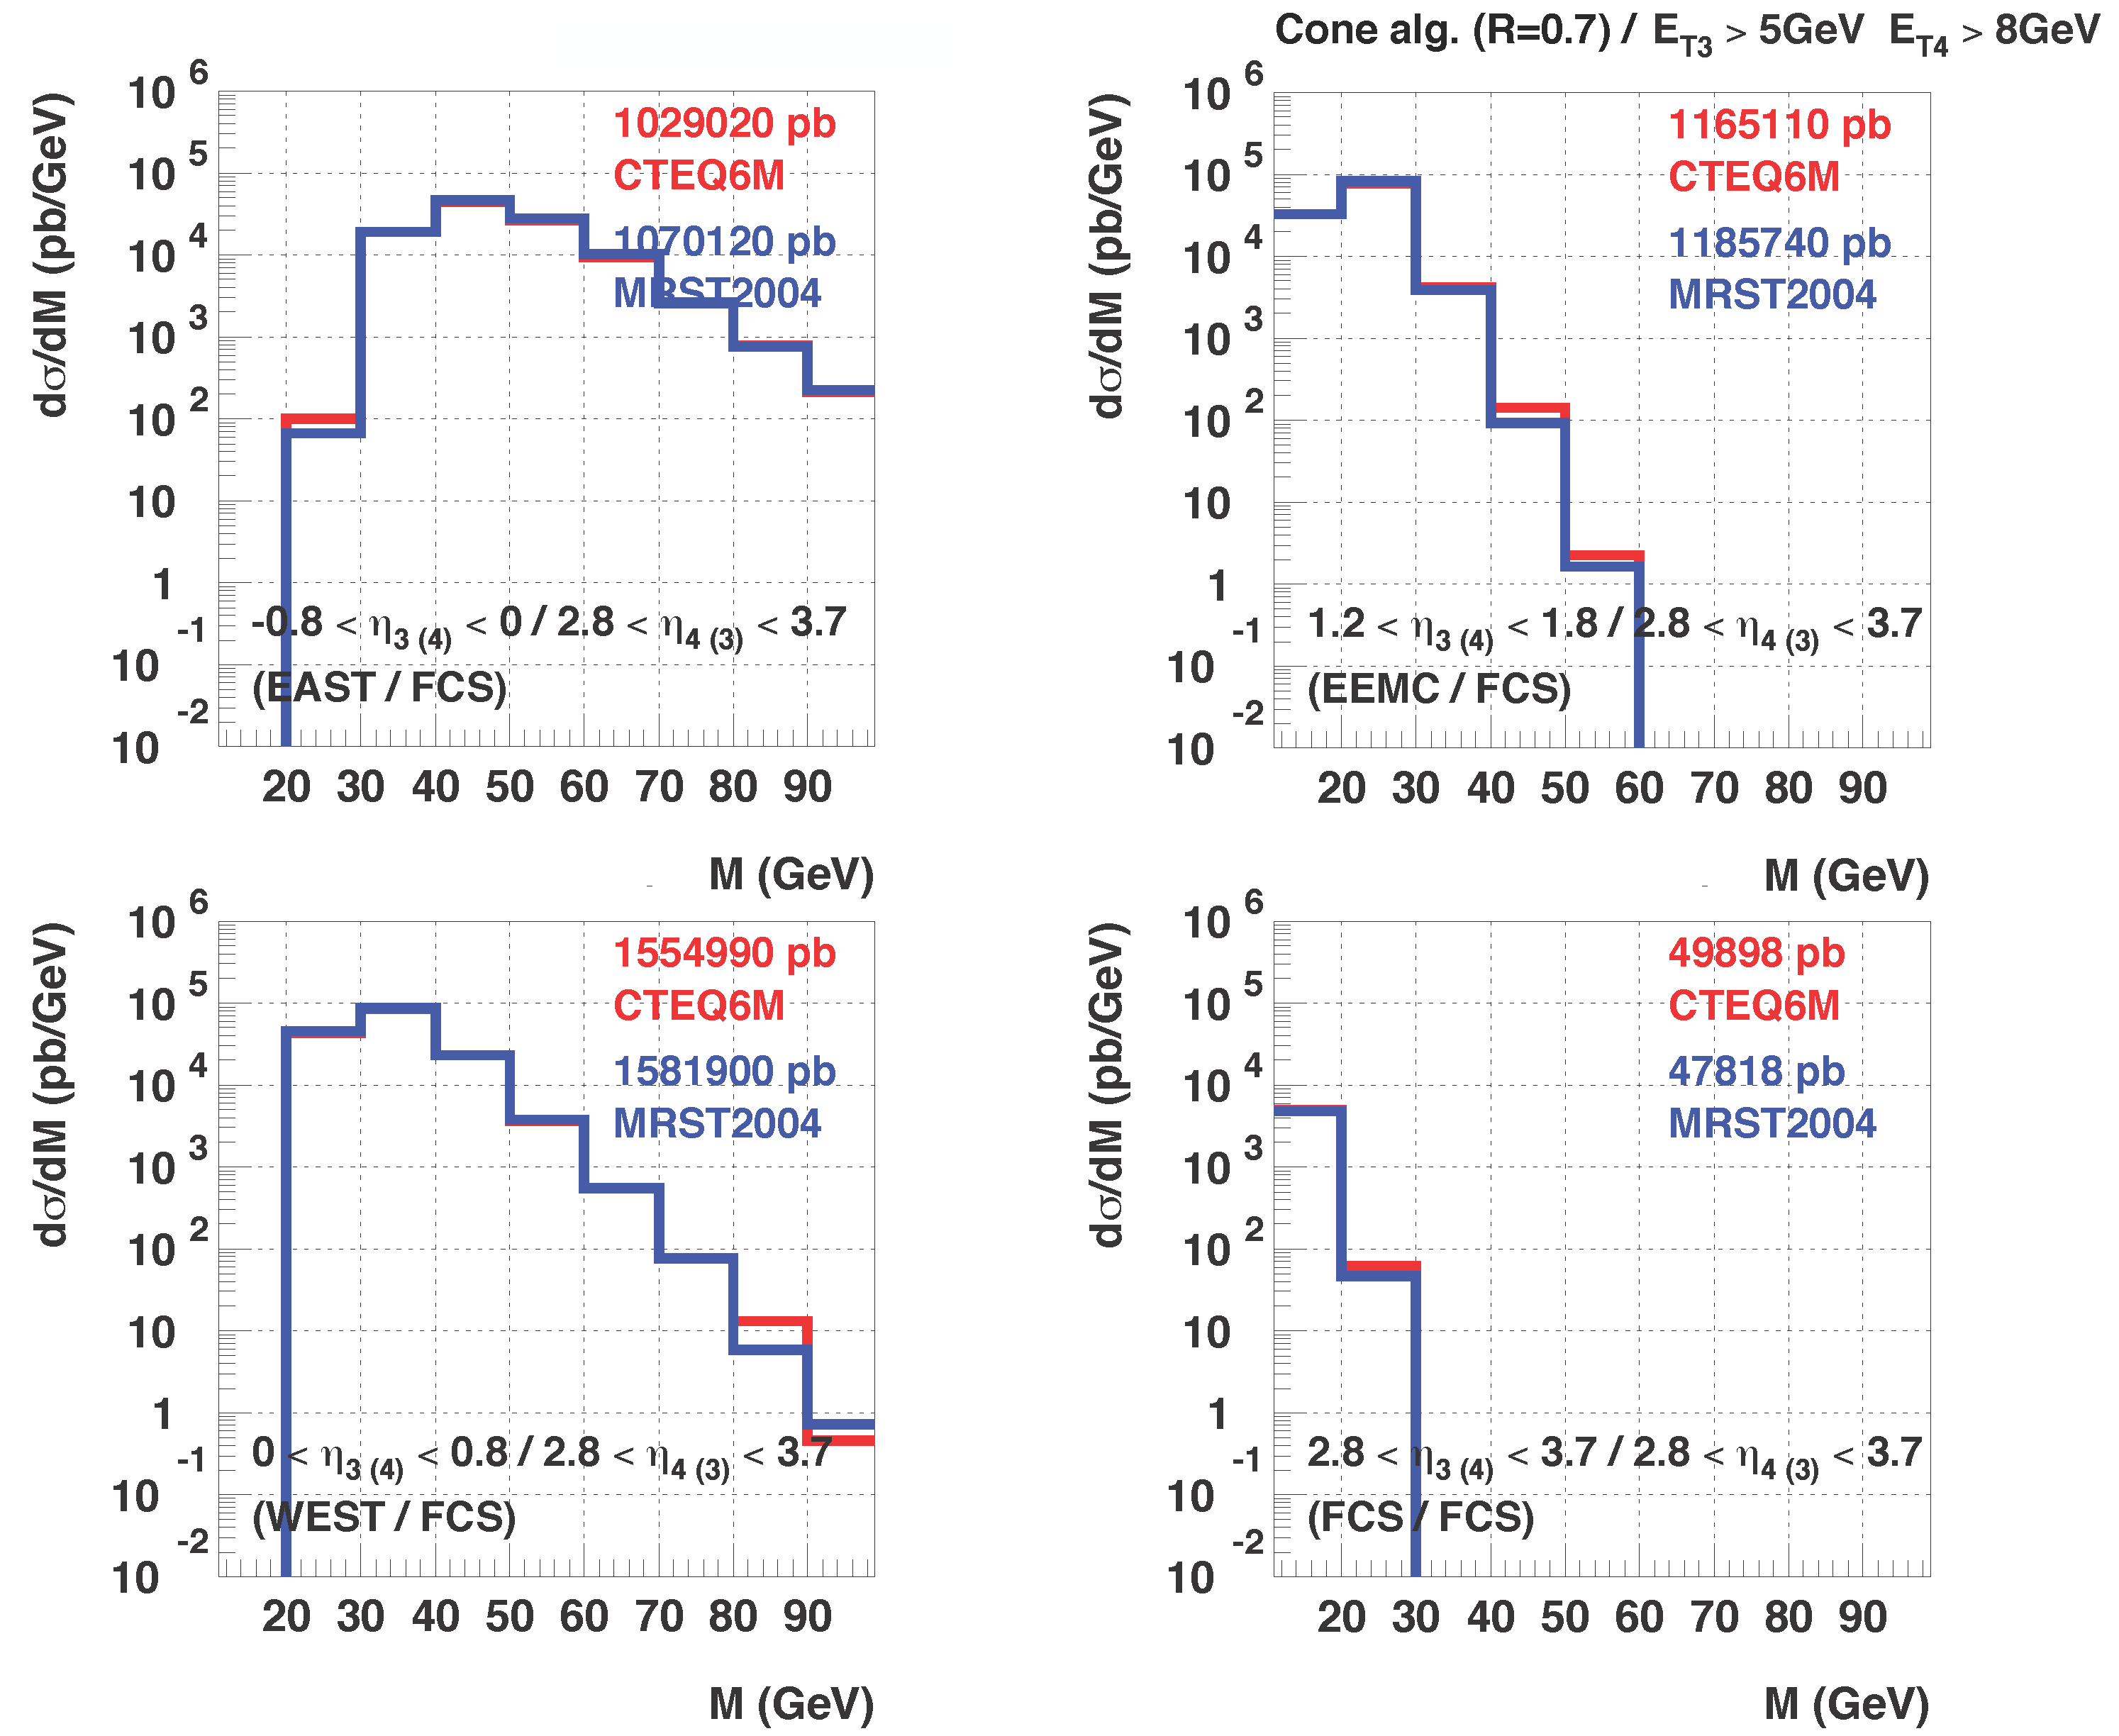
Figure 8: Invariant mass cross-section (NLO) for the forward STAR acceptance region in η of 2.8 < η < 3.7.
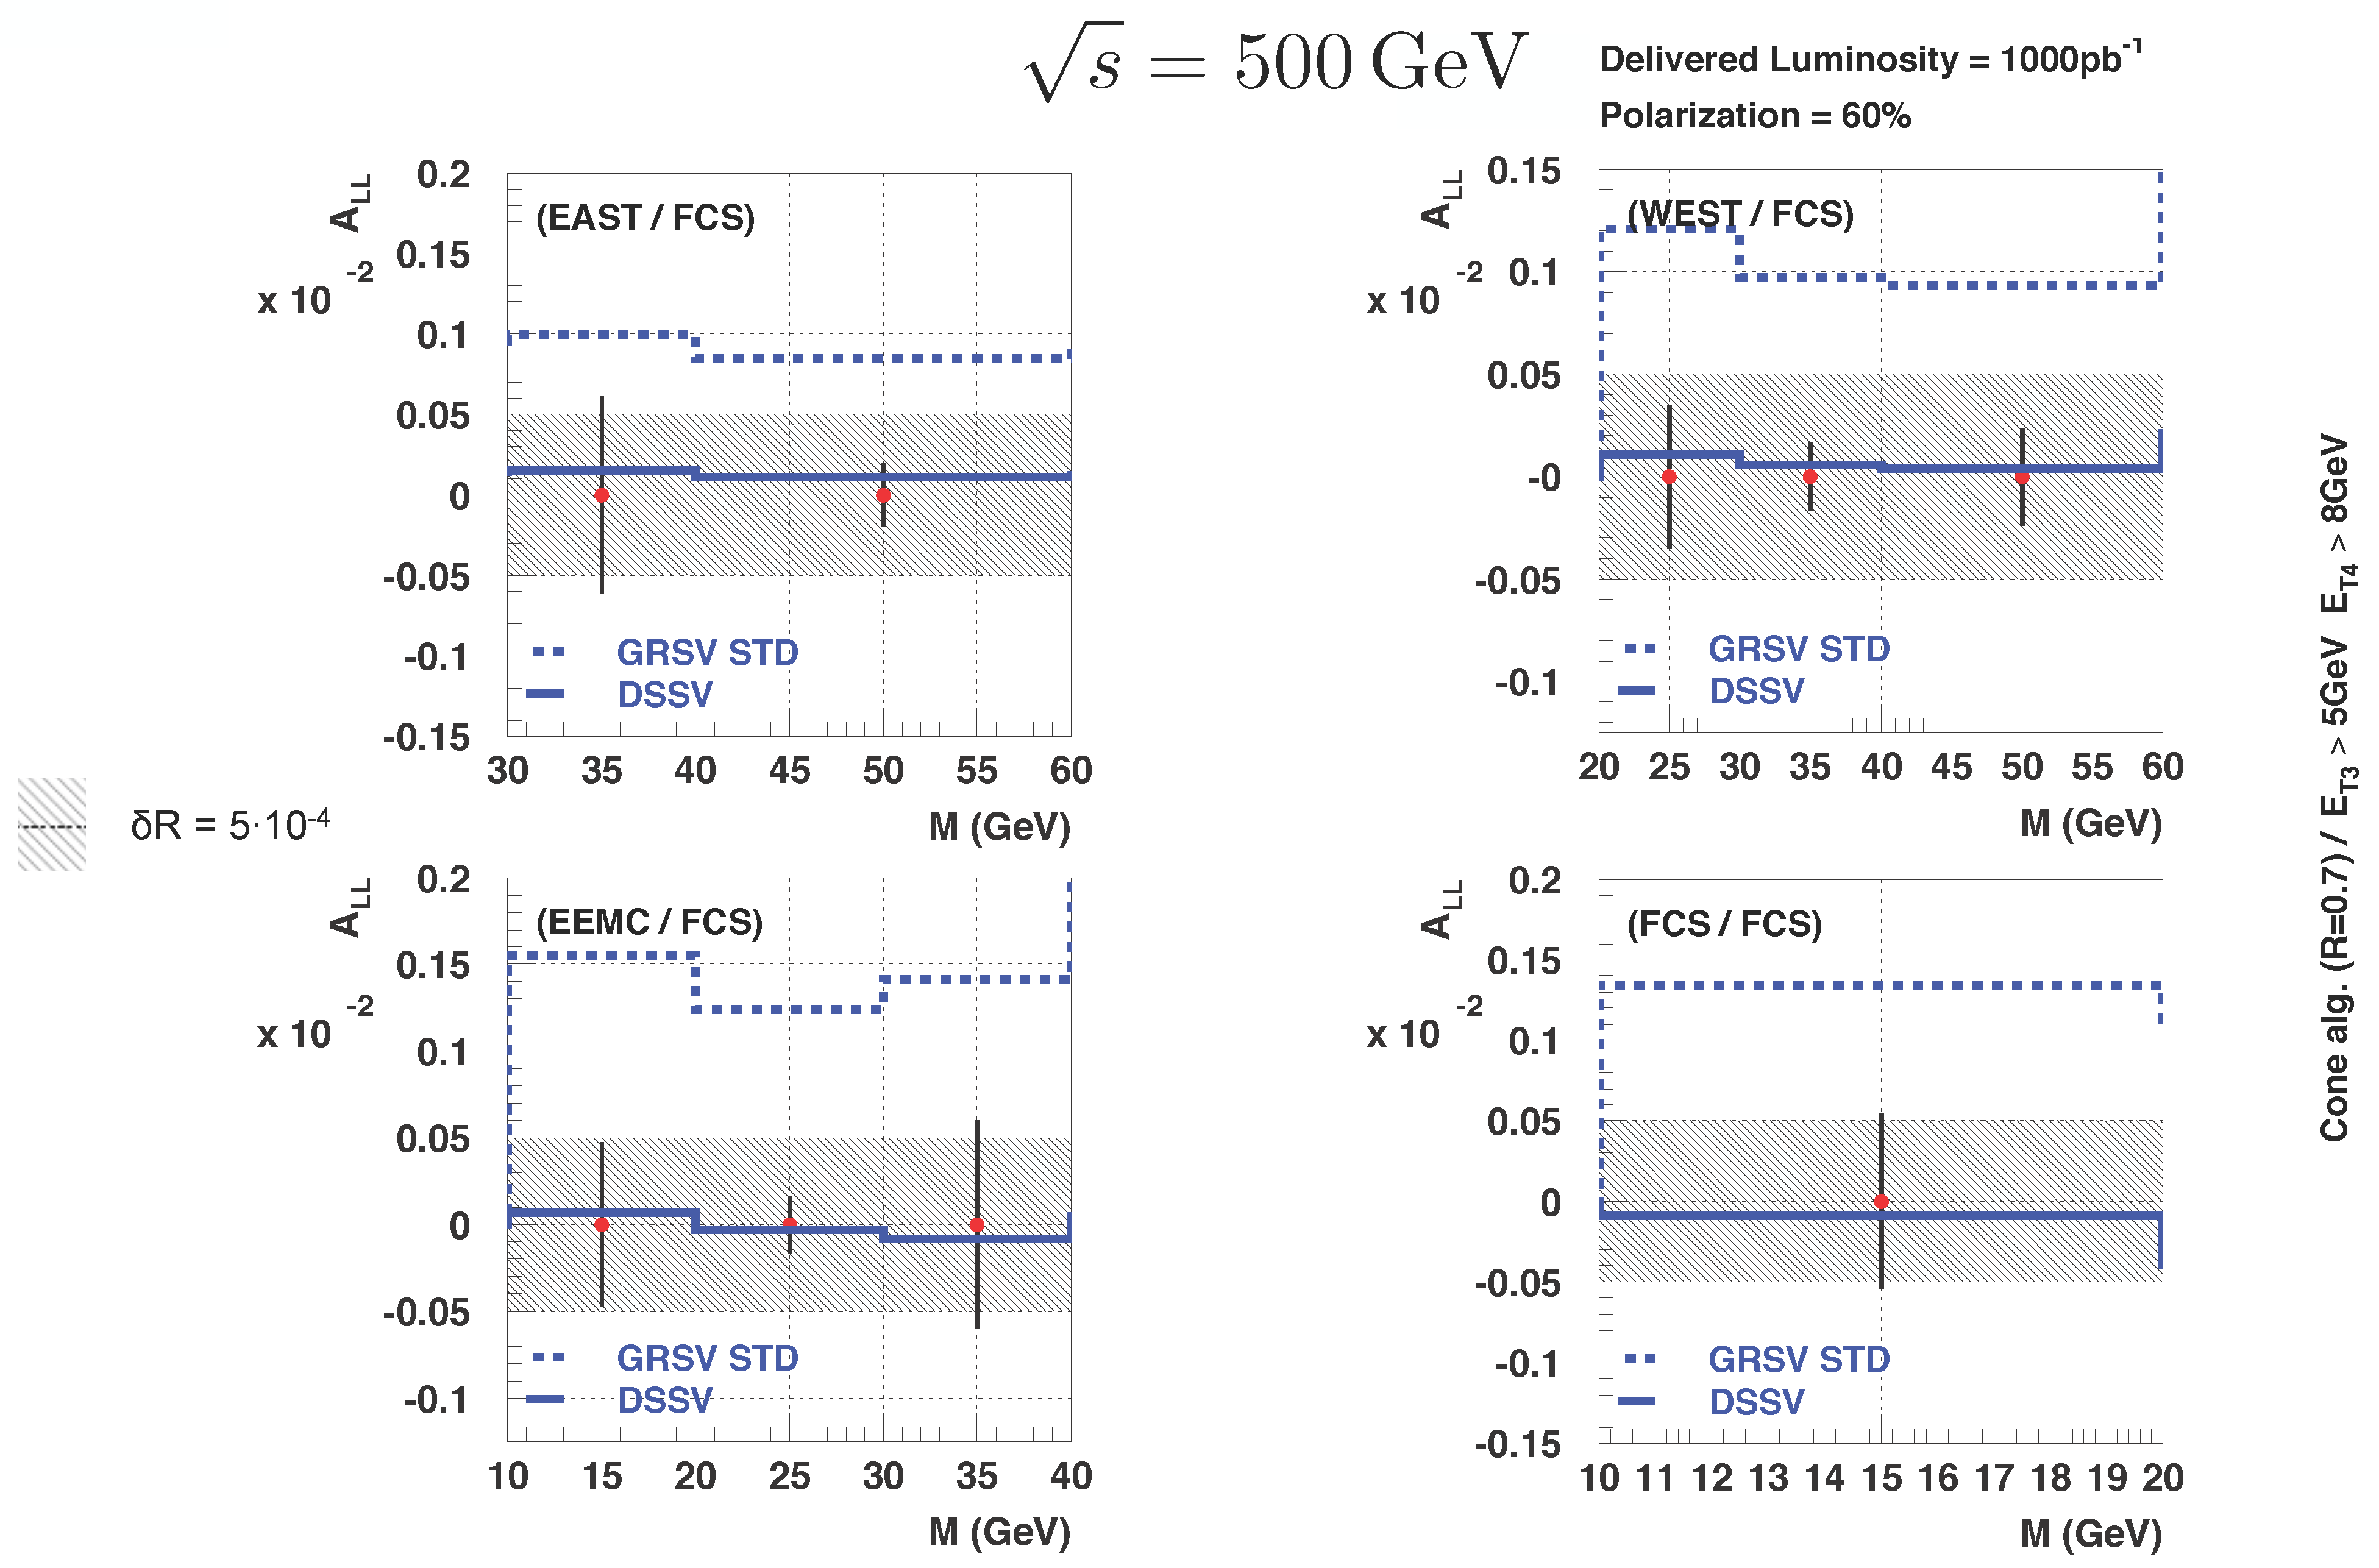
Figure 9: ALL (NLO) for the forward STAR acceptance region in η of 2.8 < η < 3.7 together with projected projected statistical and systematic uncertainties.
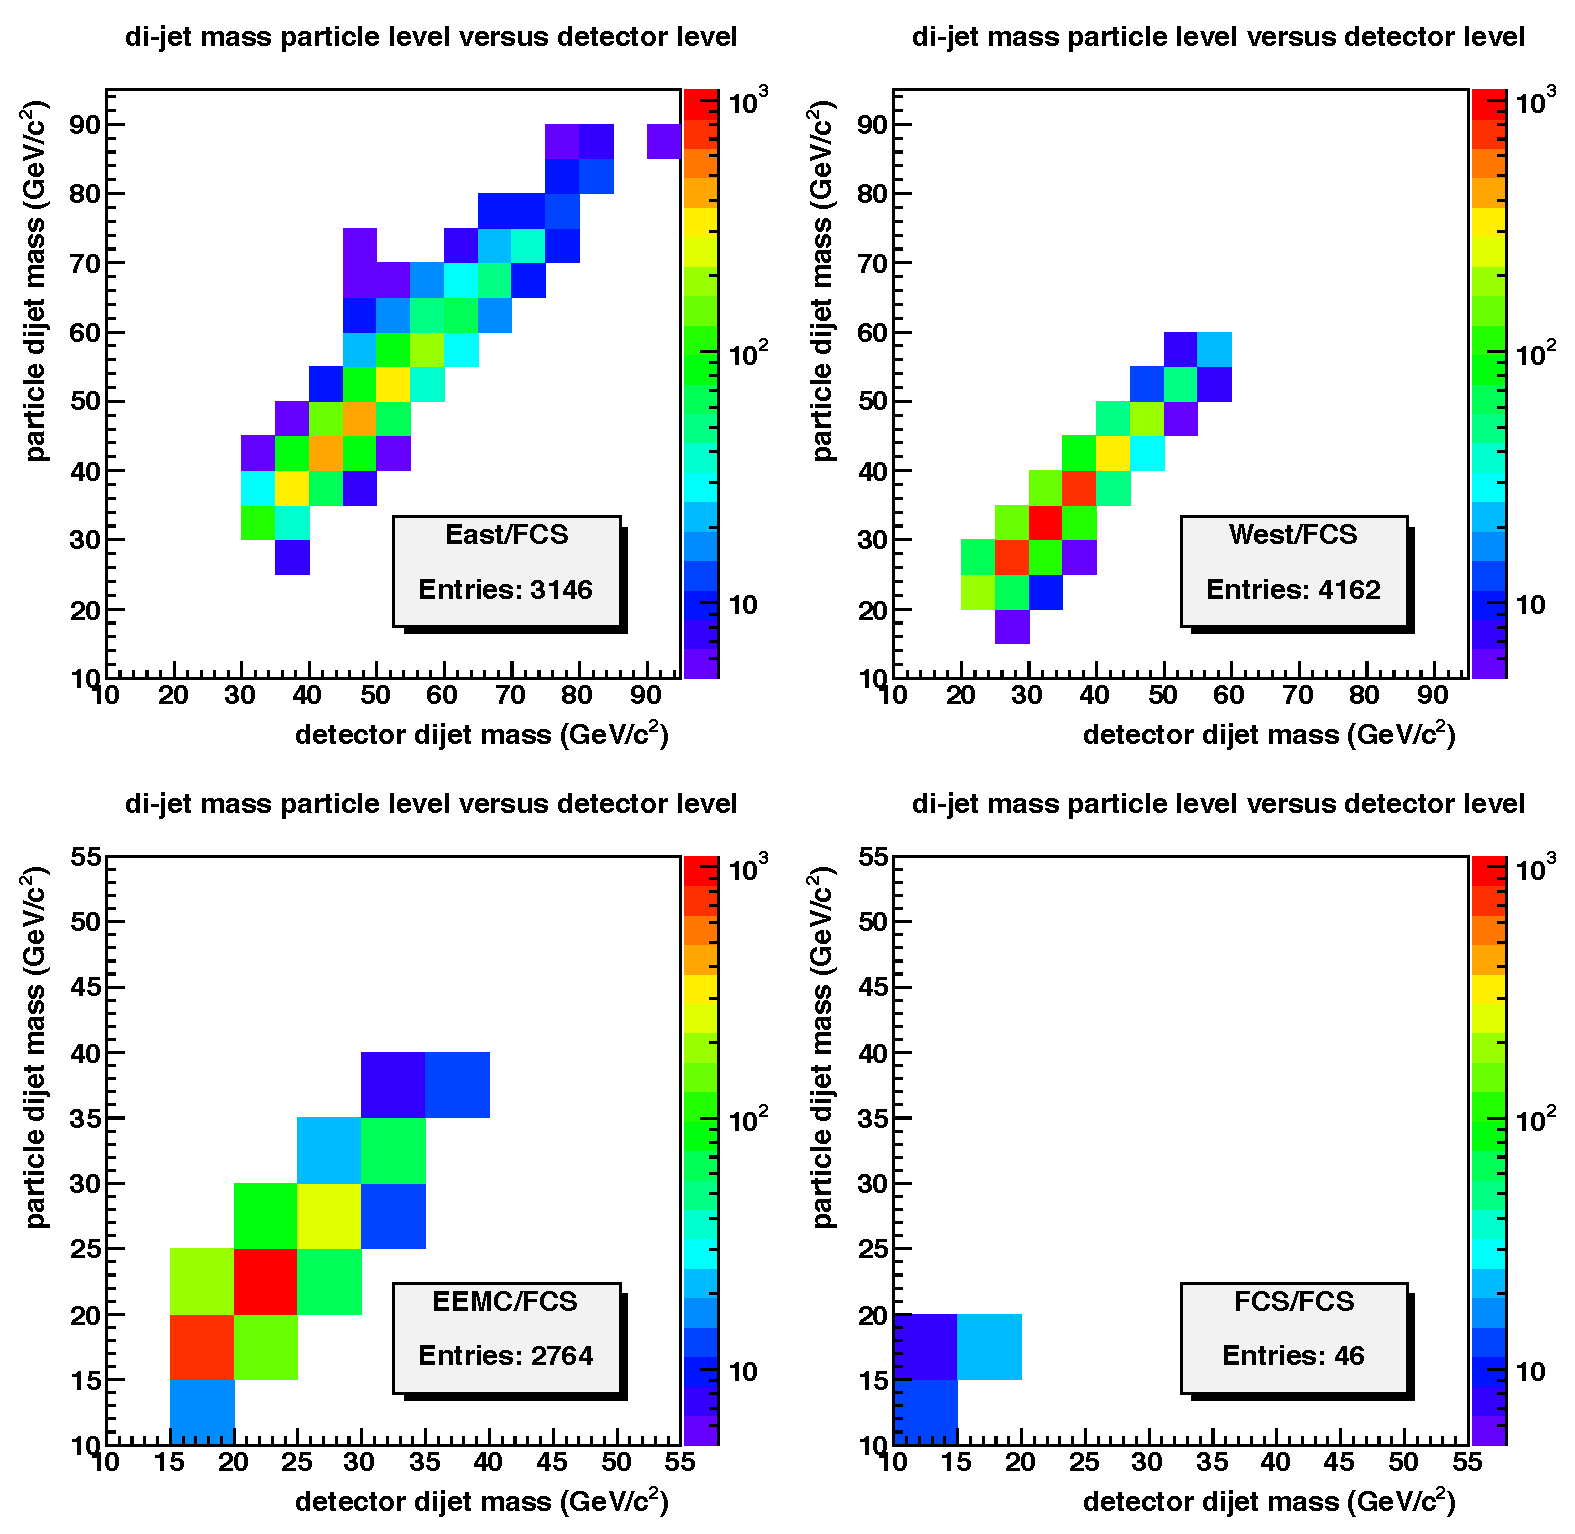
Figure 10: Correlation of the particle and detector di-jet mass including detector effects for the forward STAR acceptance region.
Groups:
- surrow's blog
- Login or register to post comments