- surrow's home page
- Posts
- 2024
- May (1)
- 2018
- 2017
- 2016
- 2015
- 2014
- October (3)
- September (1)
- August (1)
- July (1)
- June (3)
- May (4)
- April (6)
- March (4)
- February (5)
- January (2)
- 2013
- December (2)
- November (1)
- October (1)
- September (4)
- August (6)
- July (11)
- June (8)
- May (5)
- April (5)
- March (11)
- February (4)
- 2012
- December (3)
- November (3)
- October (3)
- September (3)
- August (3)
- July (10)
- June (9)
- May (5)
- April (4)
- March (4)
- February (7)
- January (4)
- 2011
- 2010
- December (2)
- November (4)
- August (2)
- July (3)
- June (6)
- May (4)
- April (4)
- March (8)
- February (6)
- January (4)
- 2009
- My blog
- Post new blog entry
- All blogs
Projections Di-Jets at 200GeV / Run 14
Projections Di-Jets at 200GeV / Run 14
pdf-plot showing GRSV-STD and DSSV (2008) in comparison to 90% C.L. DSSV (20014) range
Assumptions:
- Delivered luminosity: 75pb-1
- Polarization: 60%
- Jet efficiencies as constrained by Run 9 data
- Ratio of recorded to delivered luminosity: 0.7
- Systematic uncertainty from rel. luminosity: 5 X 10⁻⁴
- x1x2 range at 200GeV and 500GeV (500GeV for comparison!)
- ALL projections (3X2 panel) at 200GeV and 500GeV (500GeV for comparison!)
Figures:
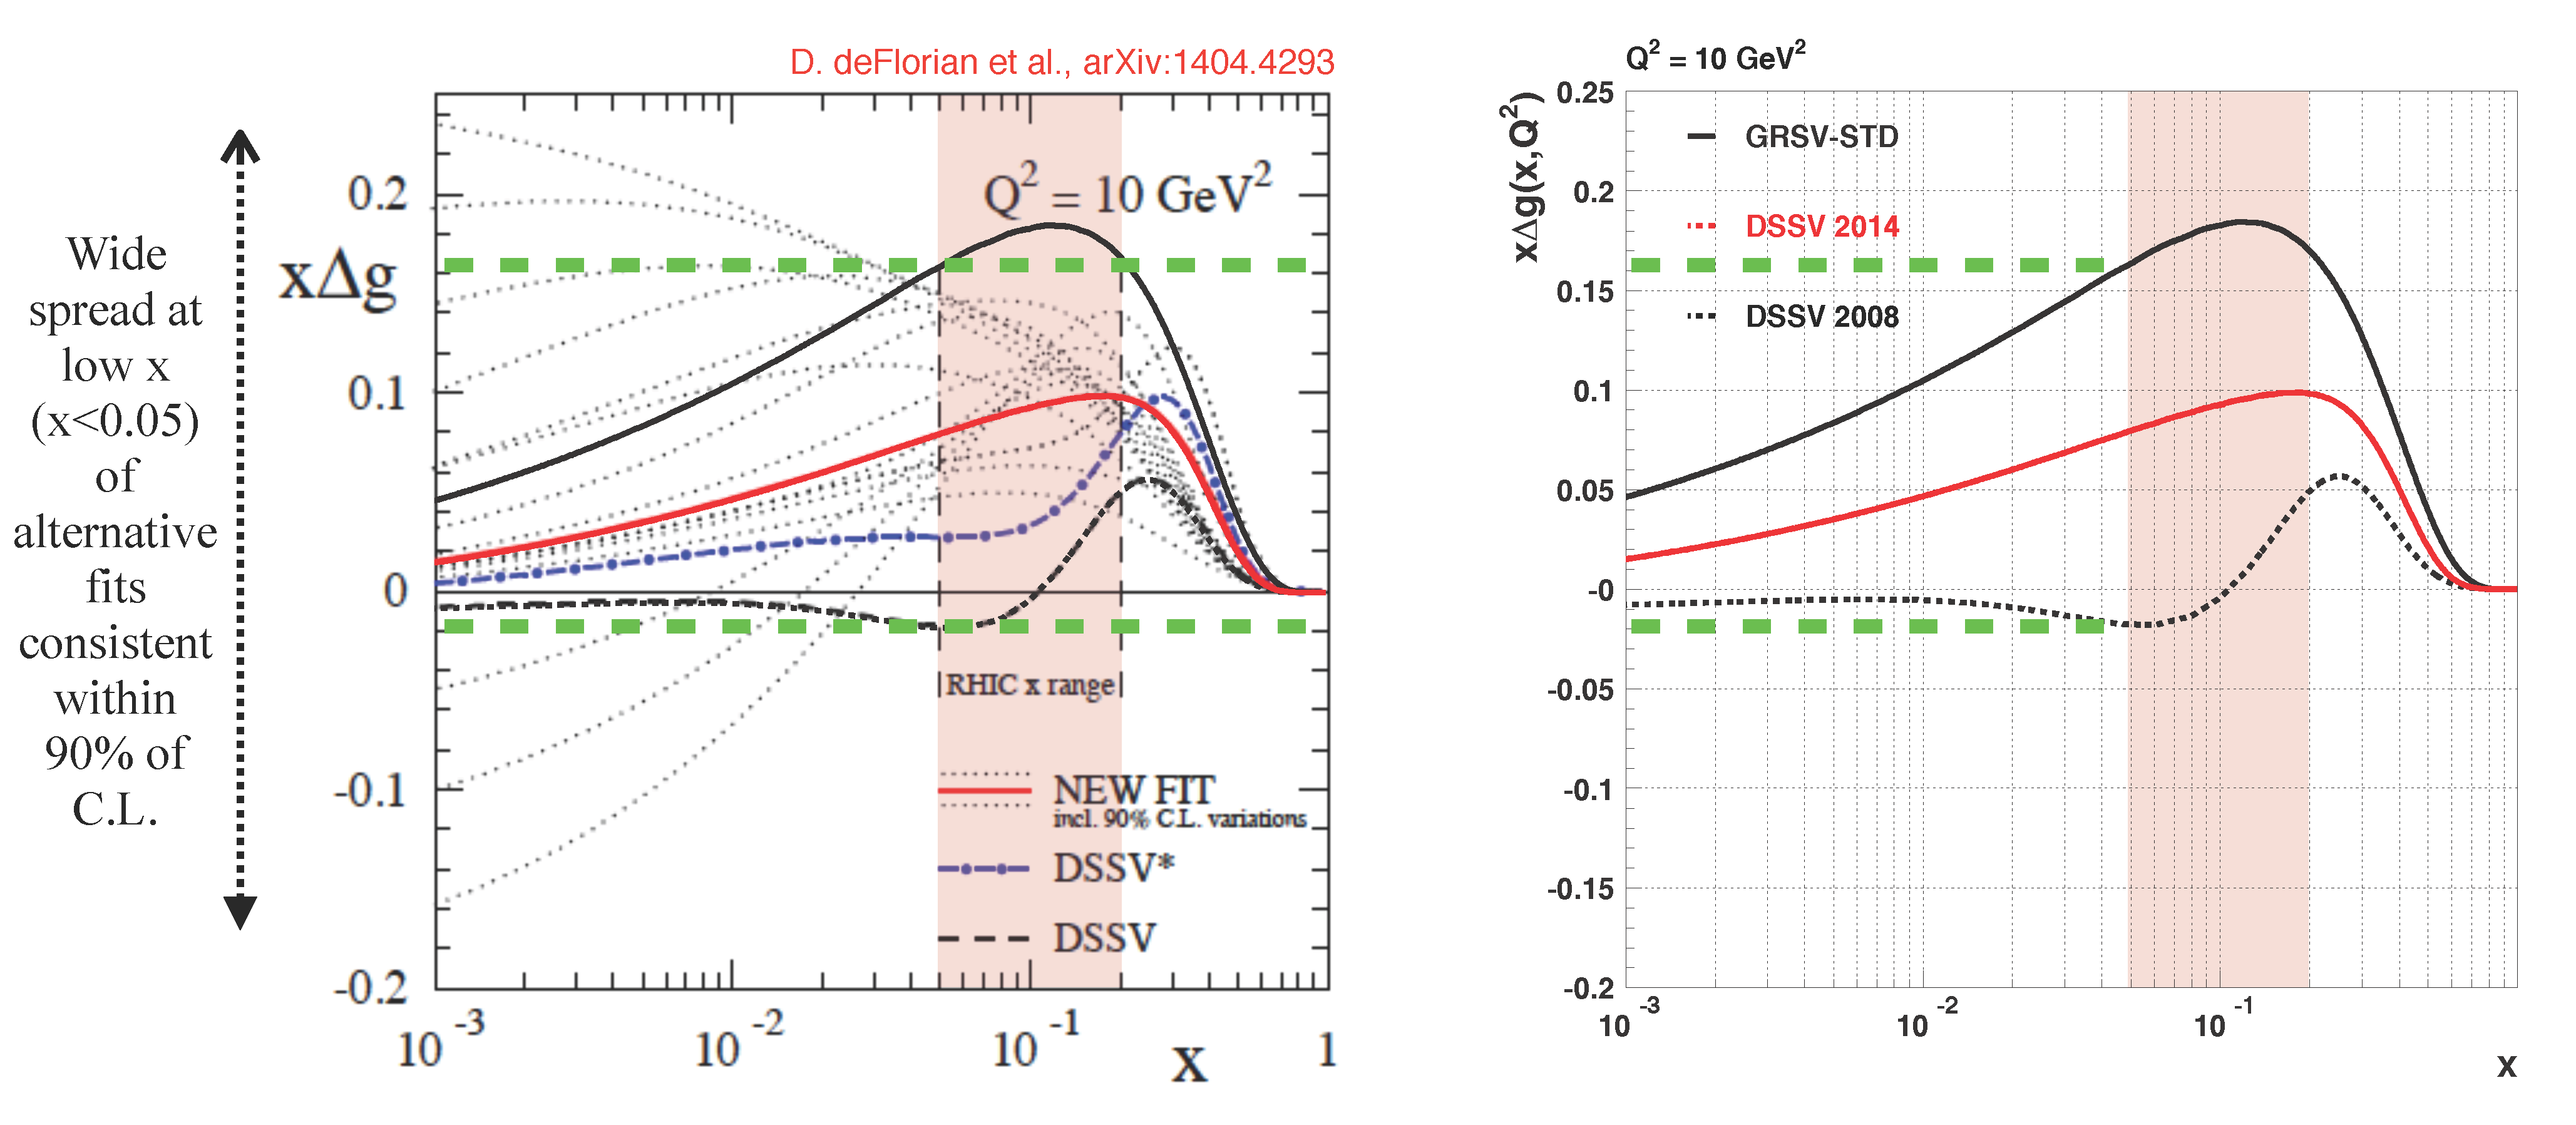
Figure 1: Polarized gluon distribution comparing DSSV (2014), DSSV (2008) and GRSV-STD.
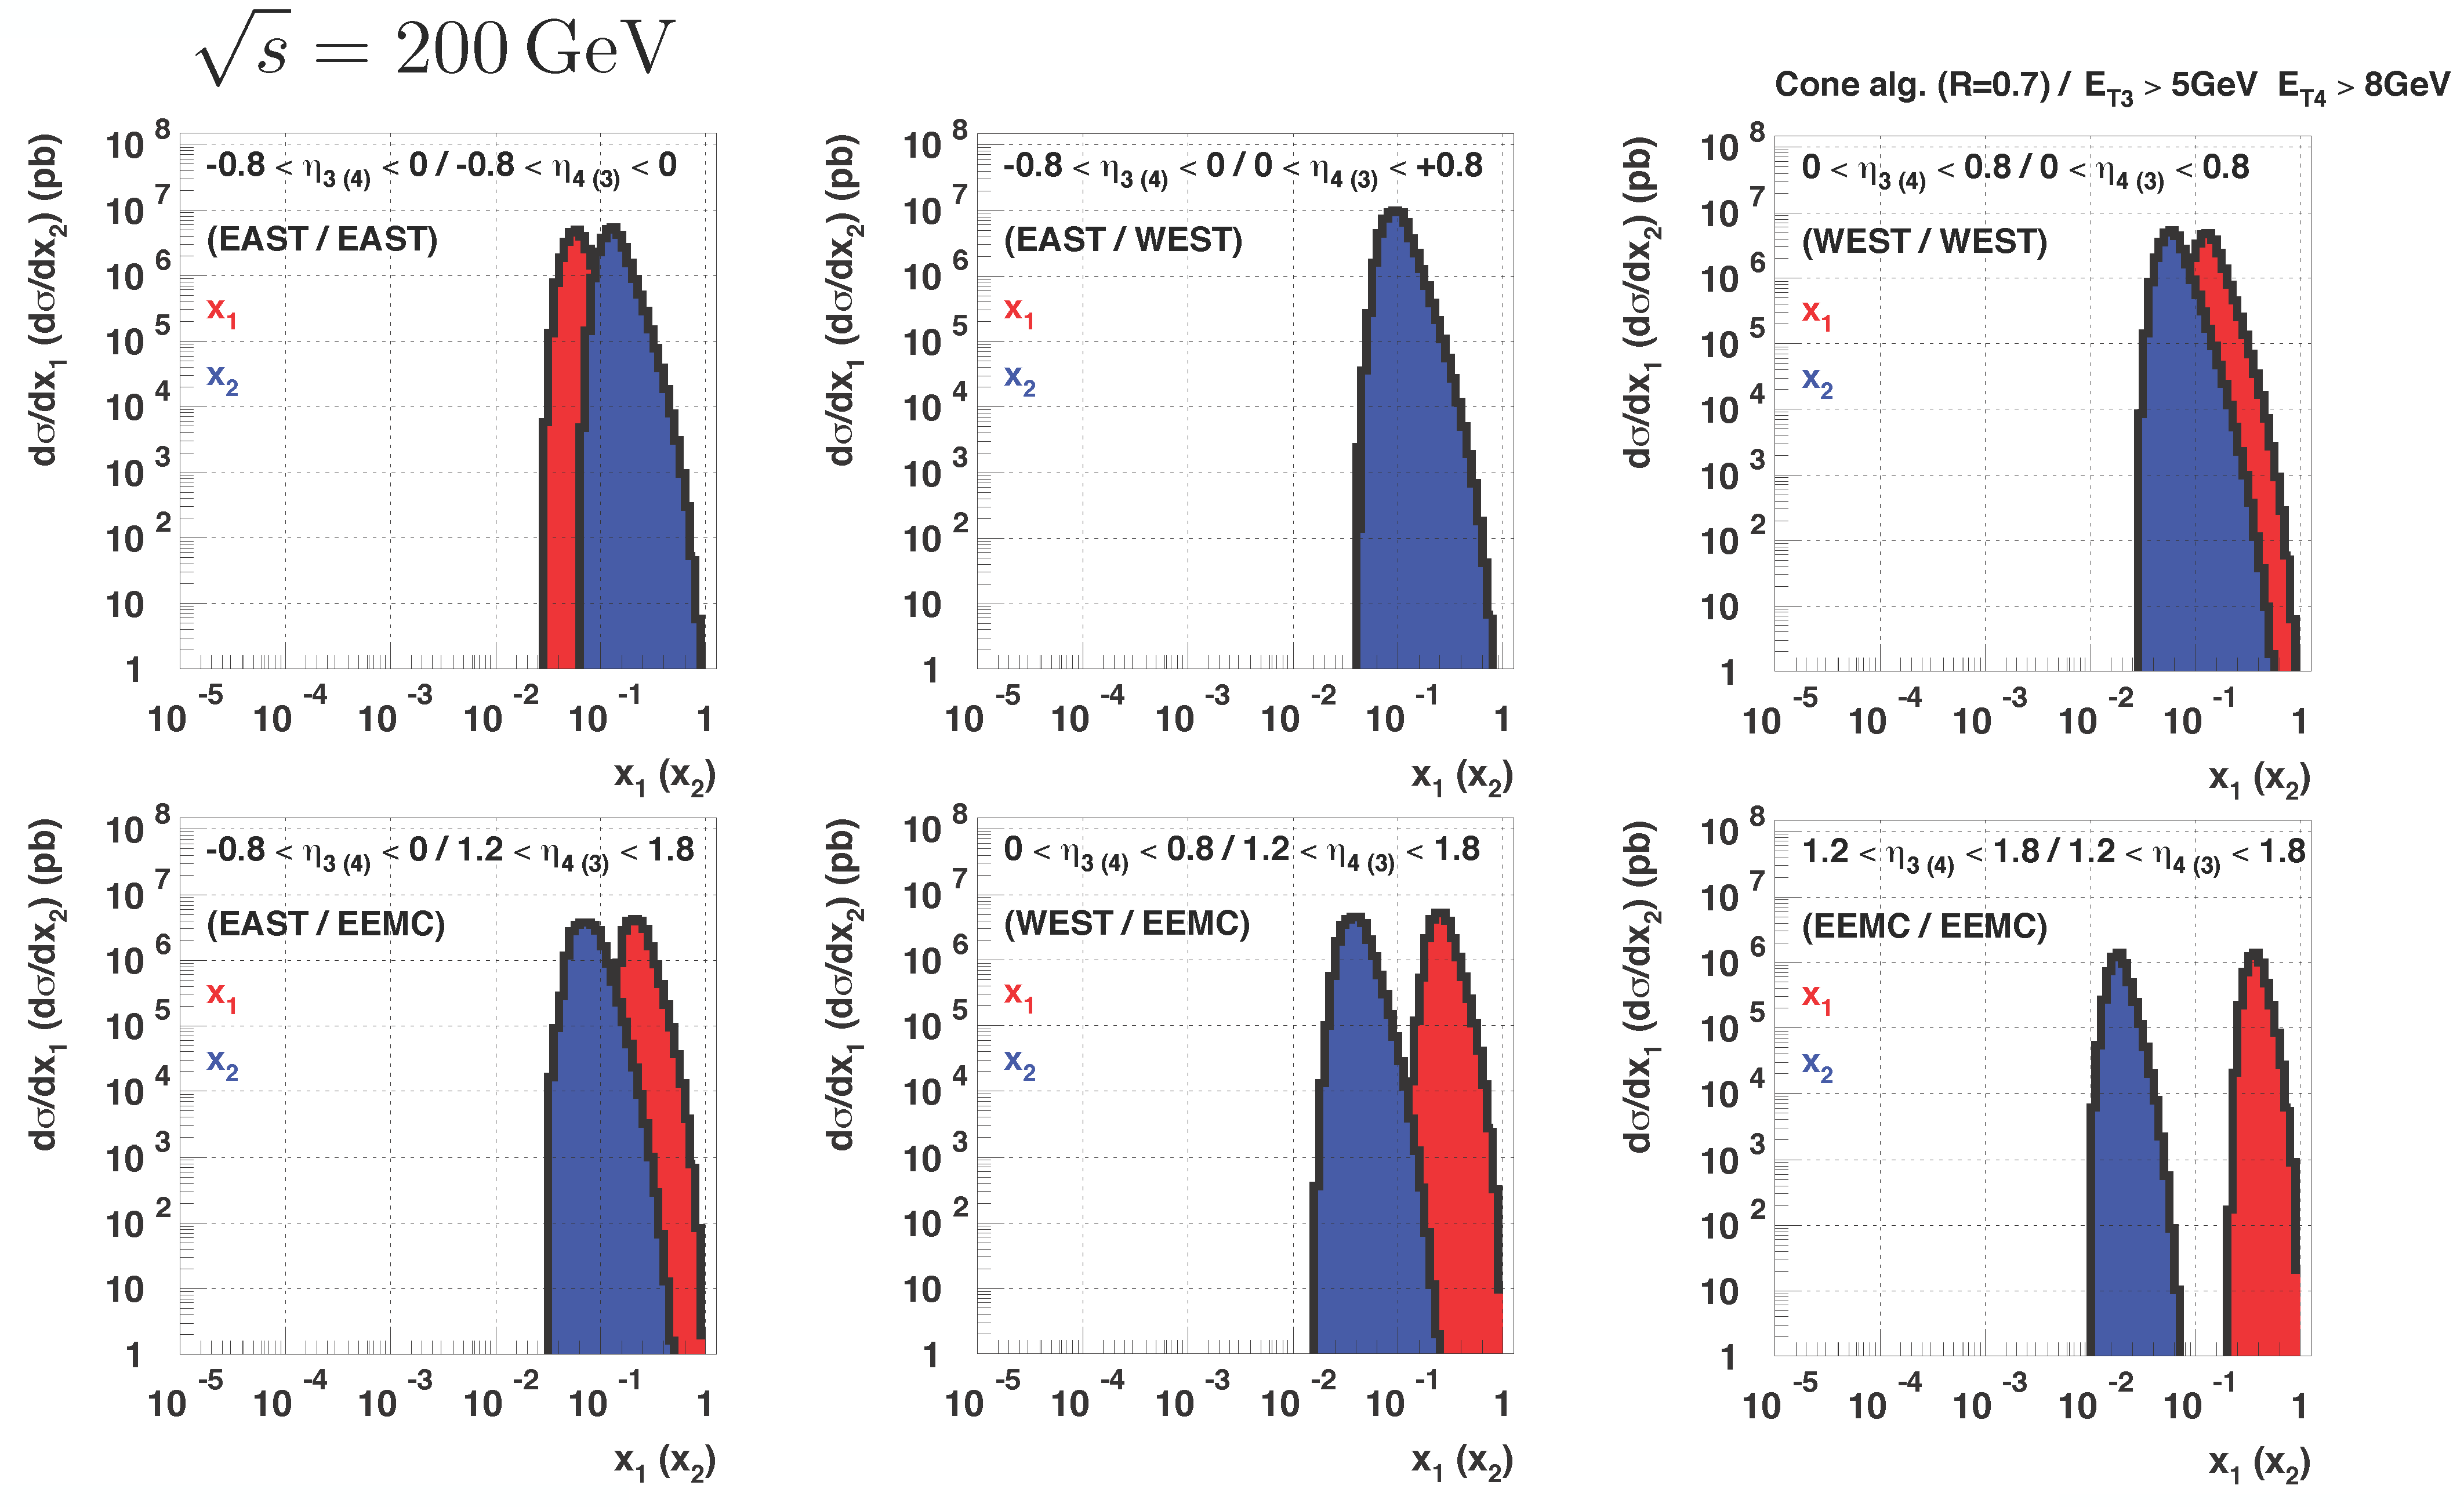
Figure 2: x1/x2 distribution at 200GeV for STAR Central.
.png)
Figure 3: x1/x2 distribution at 500GeV for STAR Central.
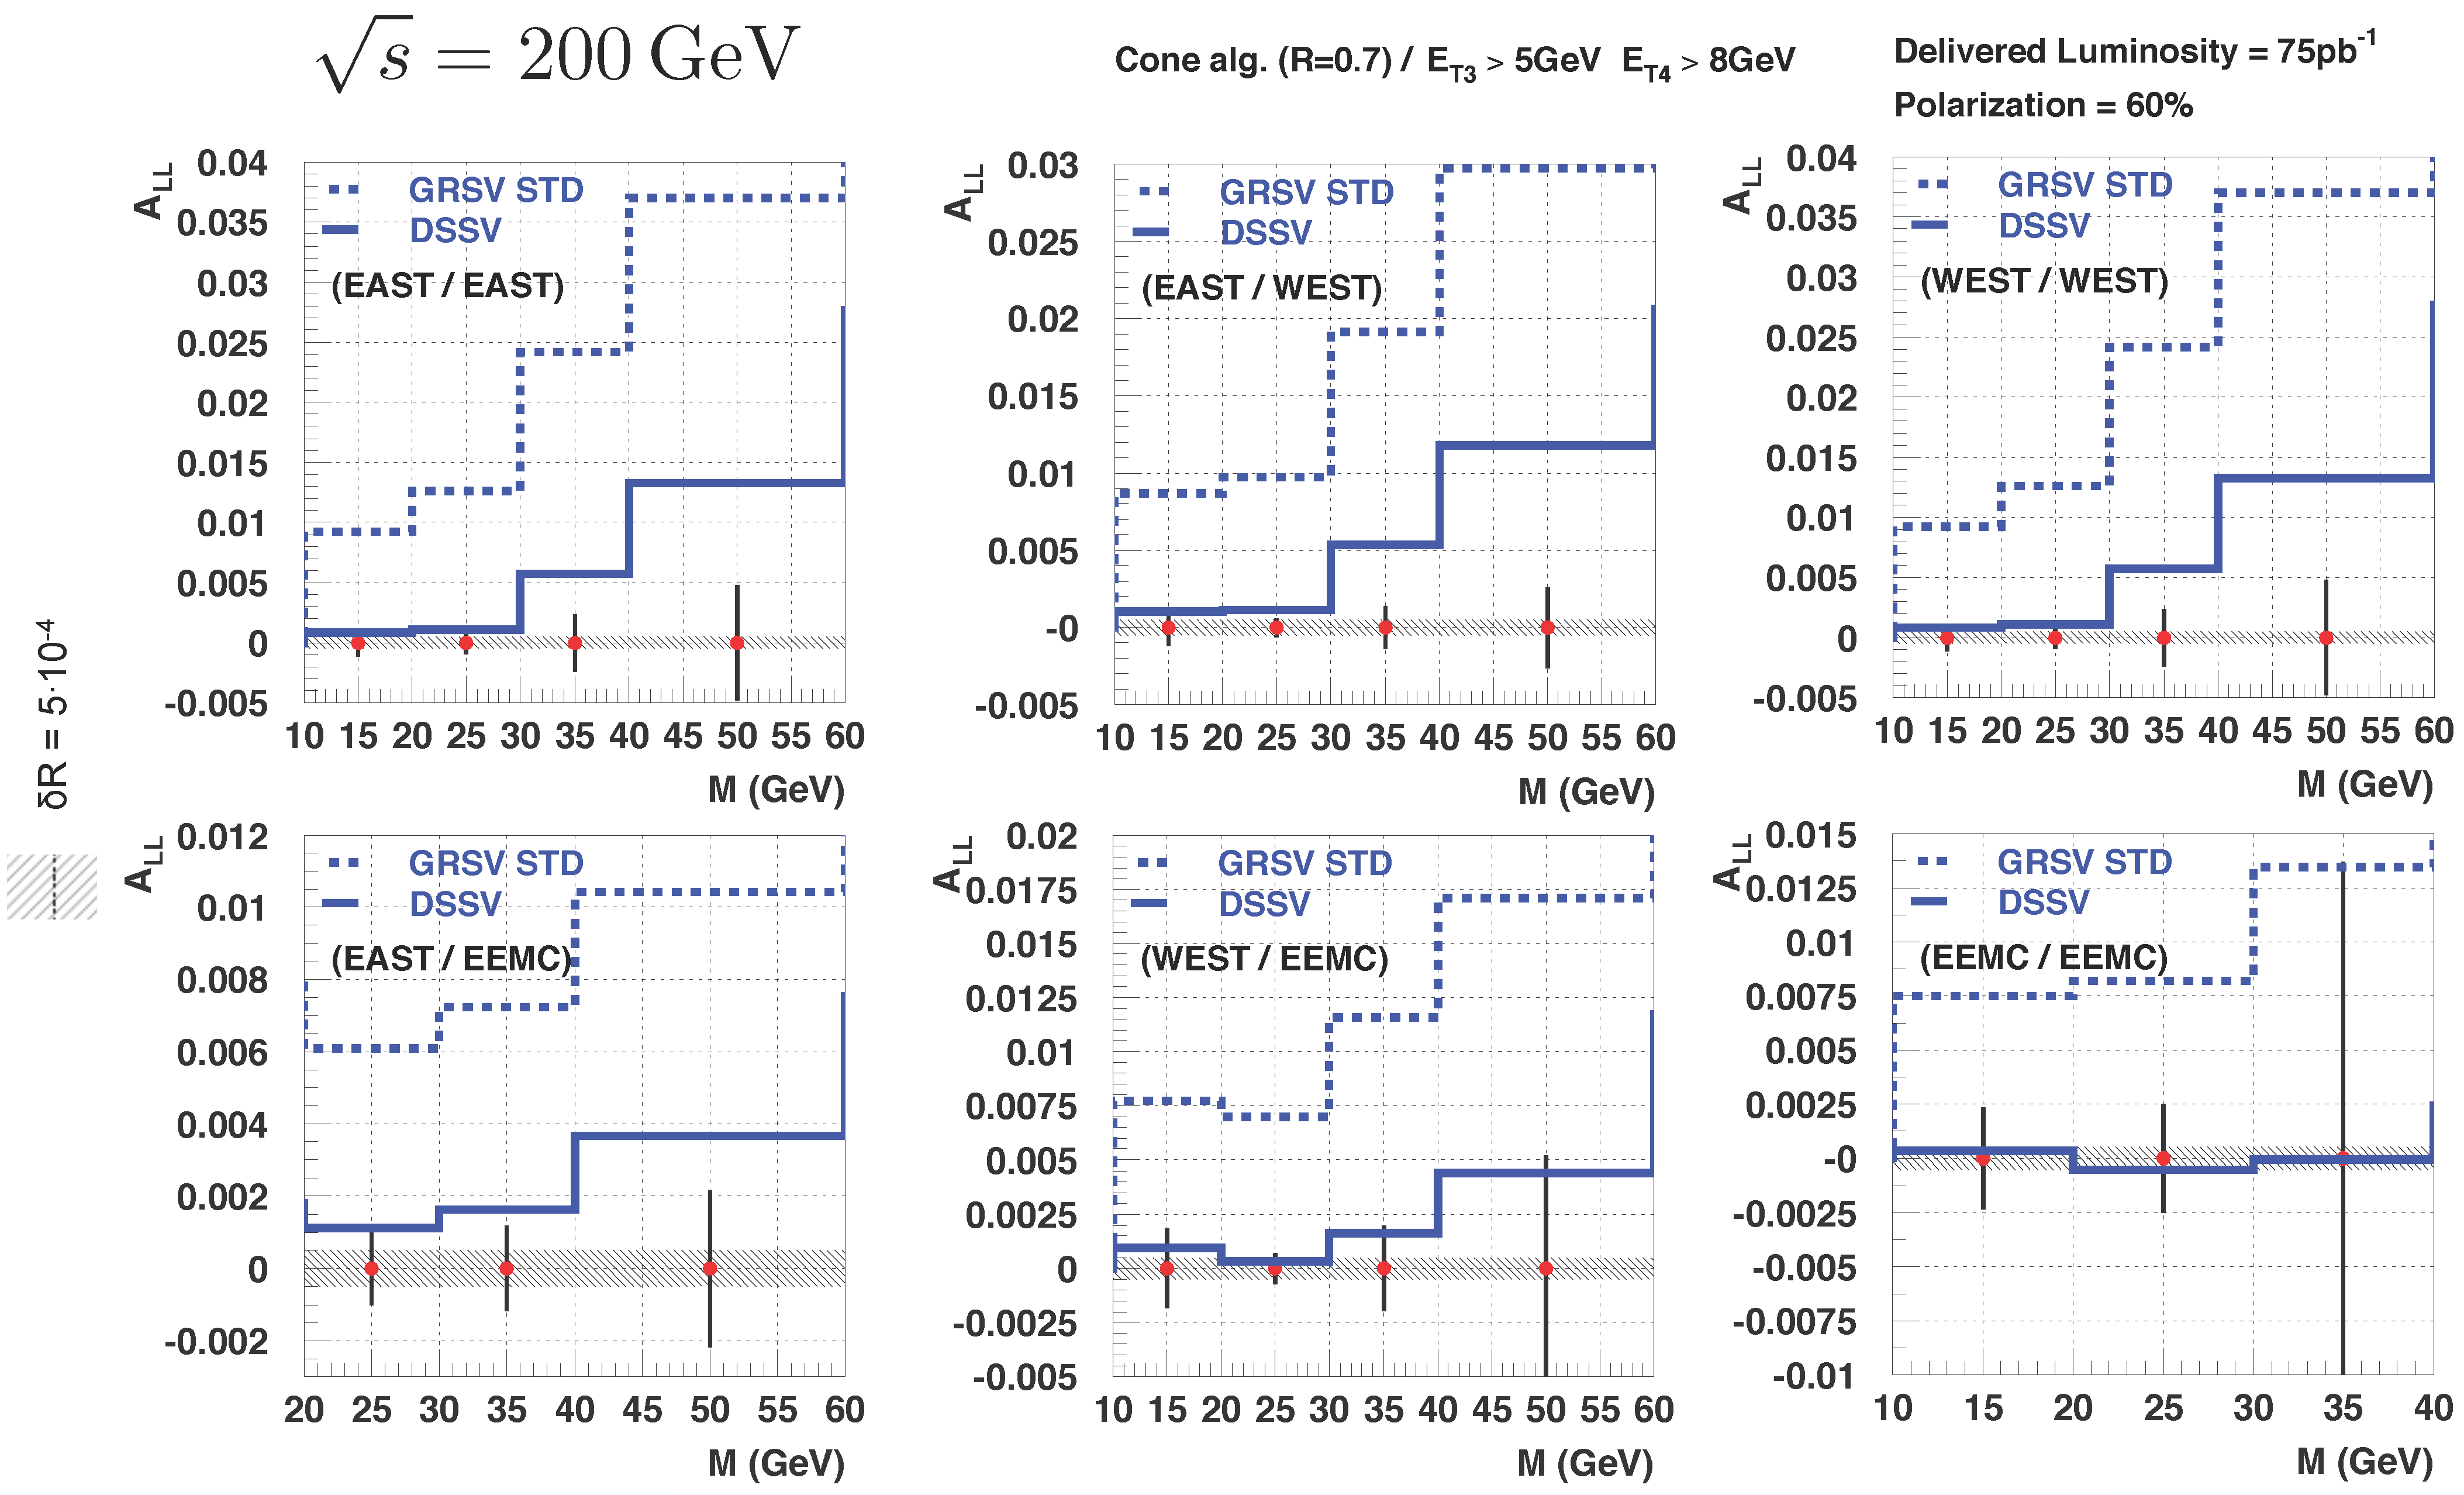
Figure 4: ALL projections at 200GeV for STAR Central.
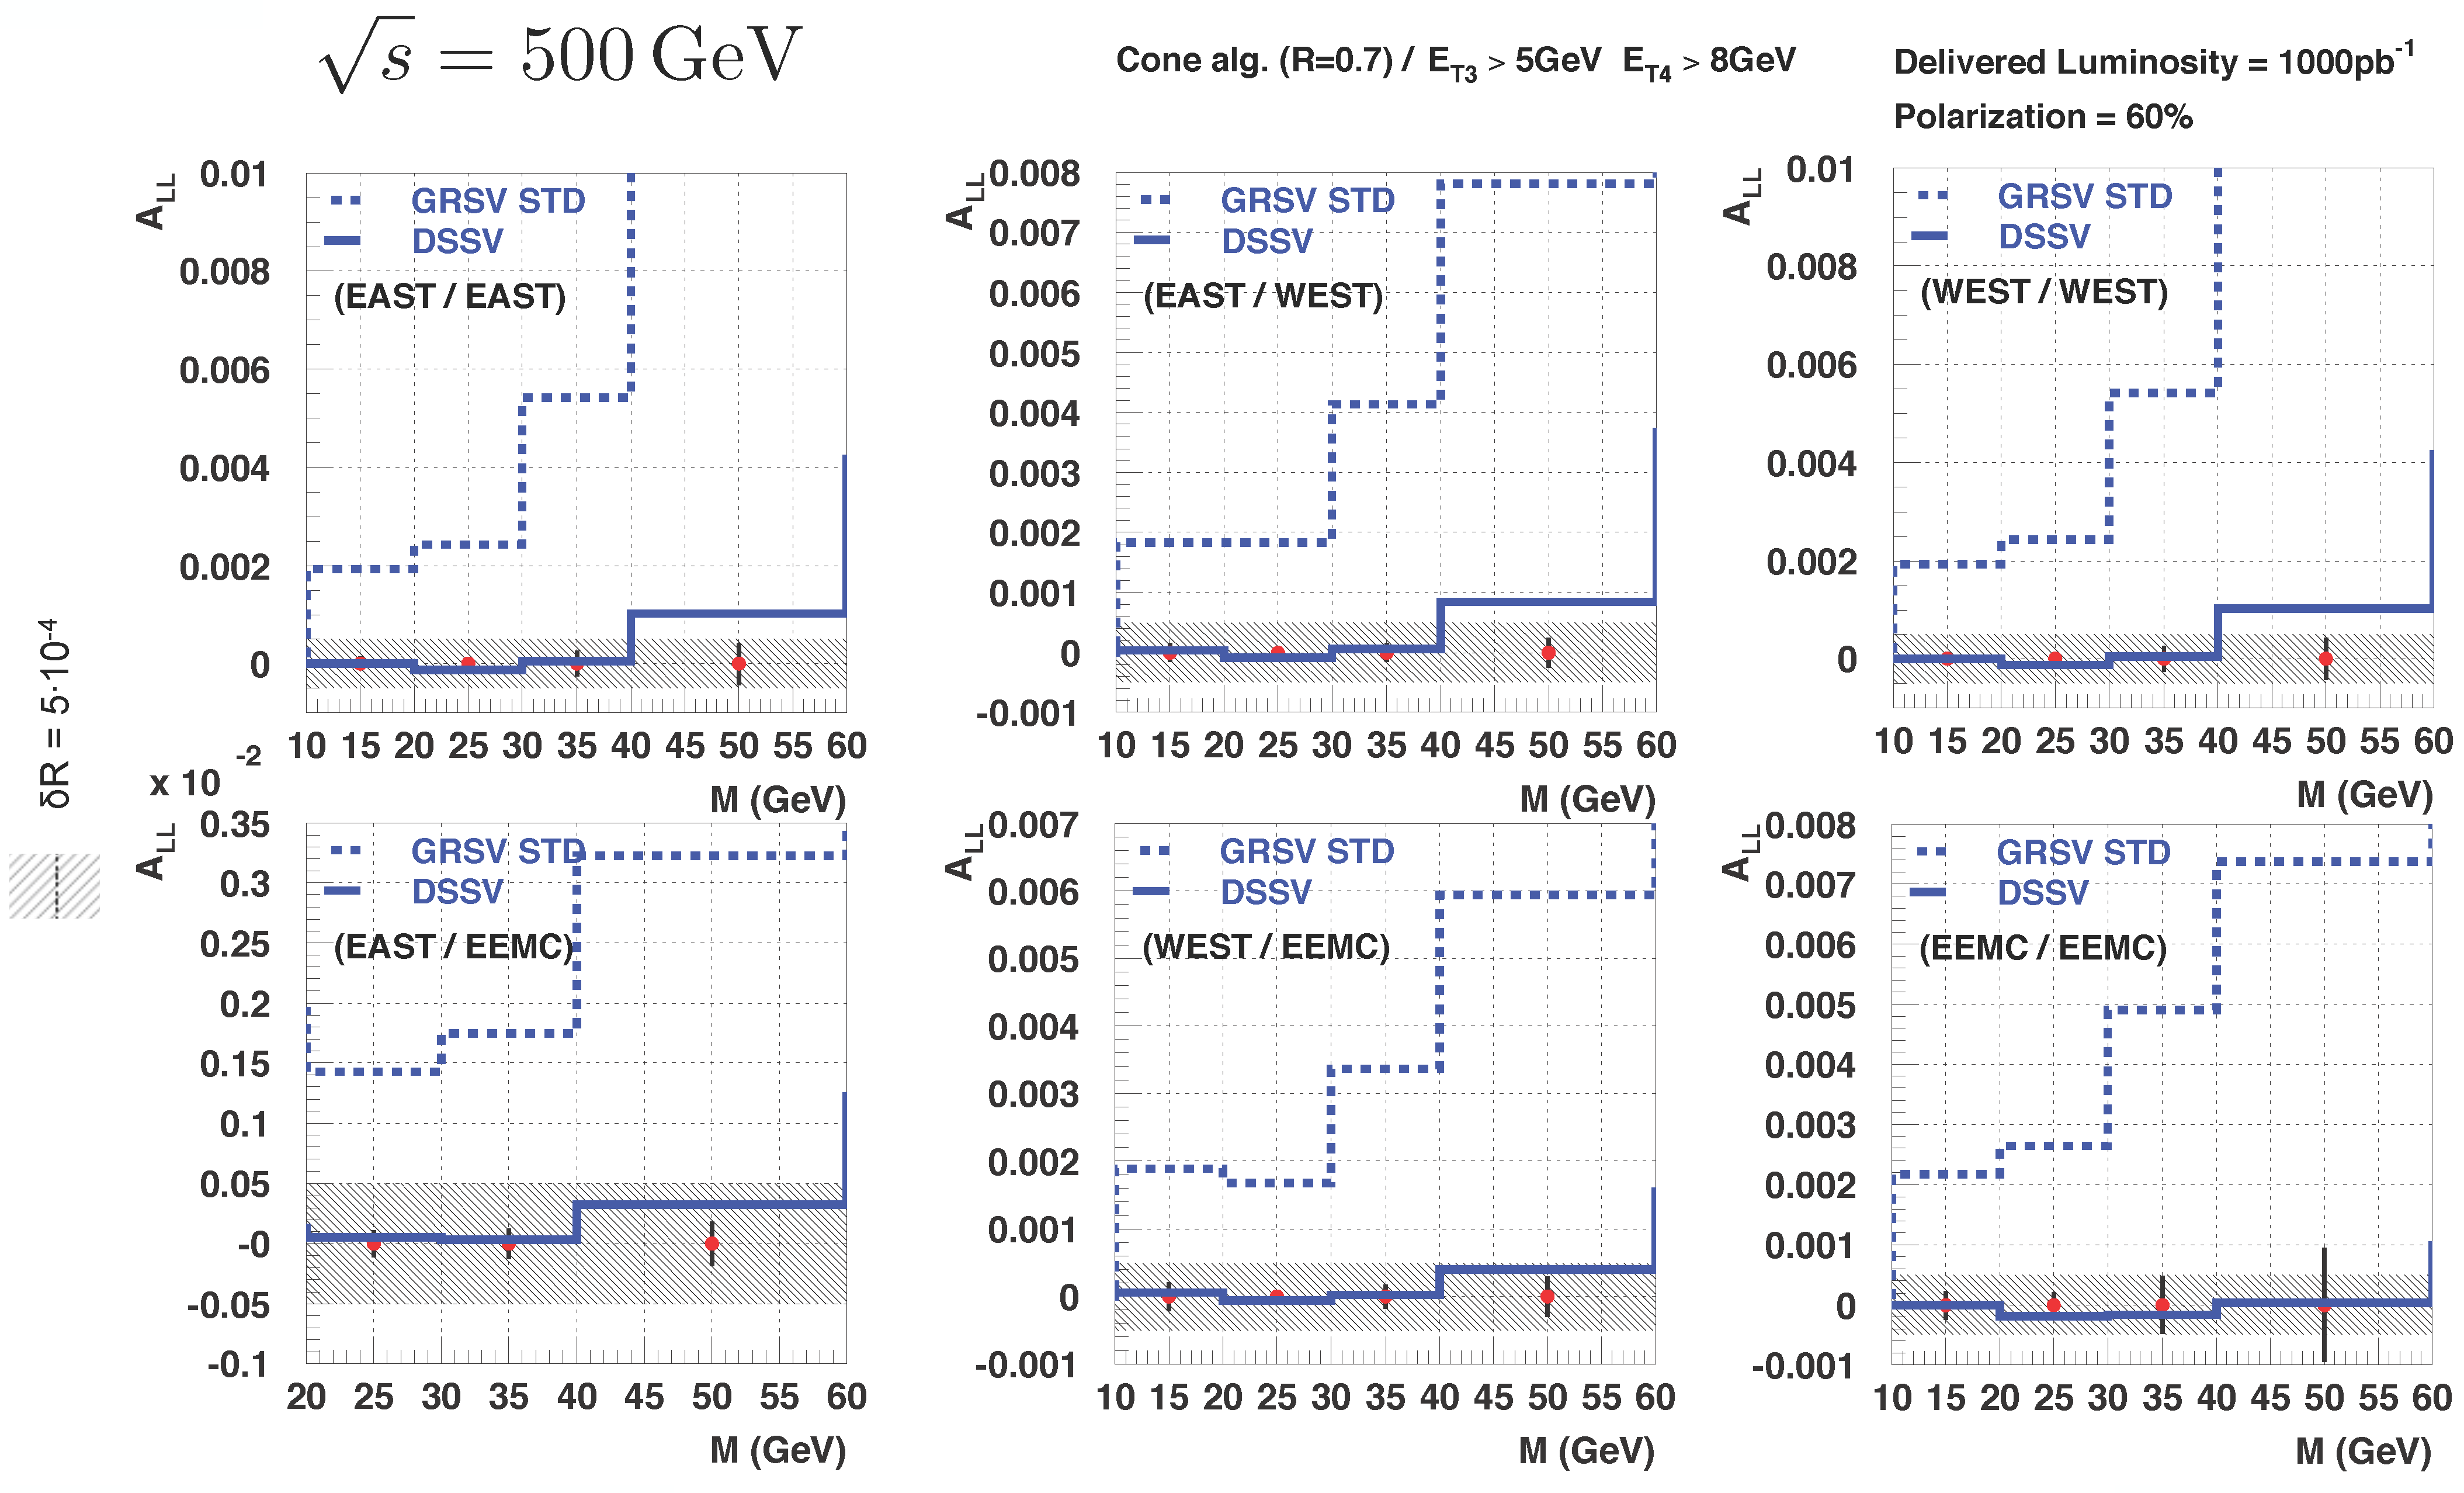
Figure 5: ALL projections at 500GeV for STAR Central.
Groups:
- surrow's blog
- Login or register to post comments