Run9 low luminosity: strange Dca distribution investigation
.png)
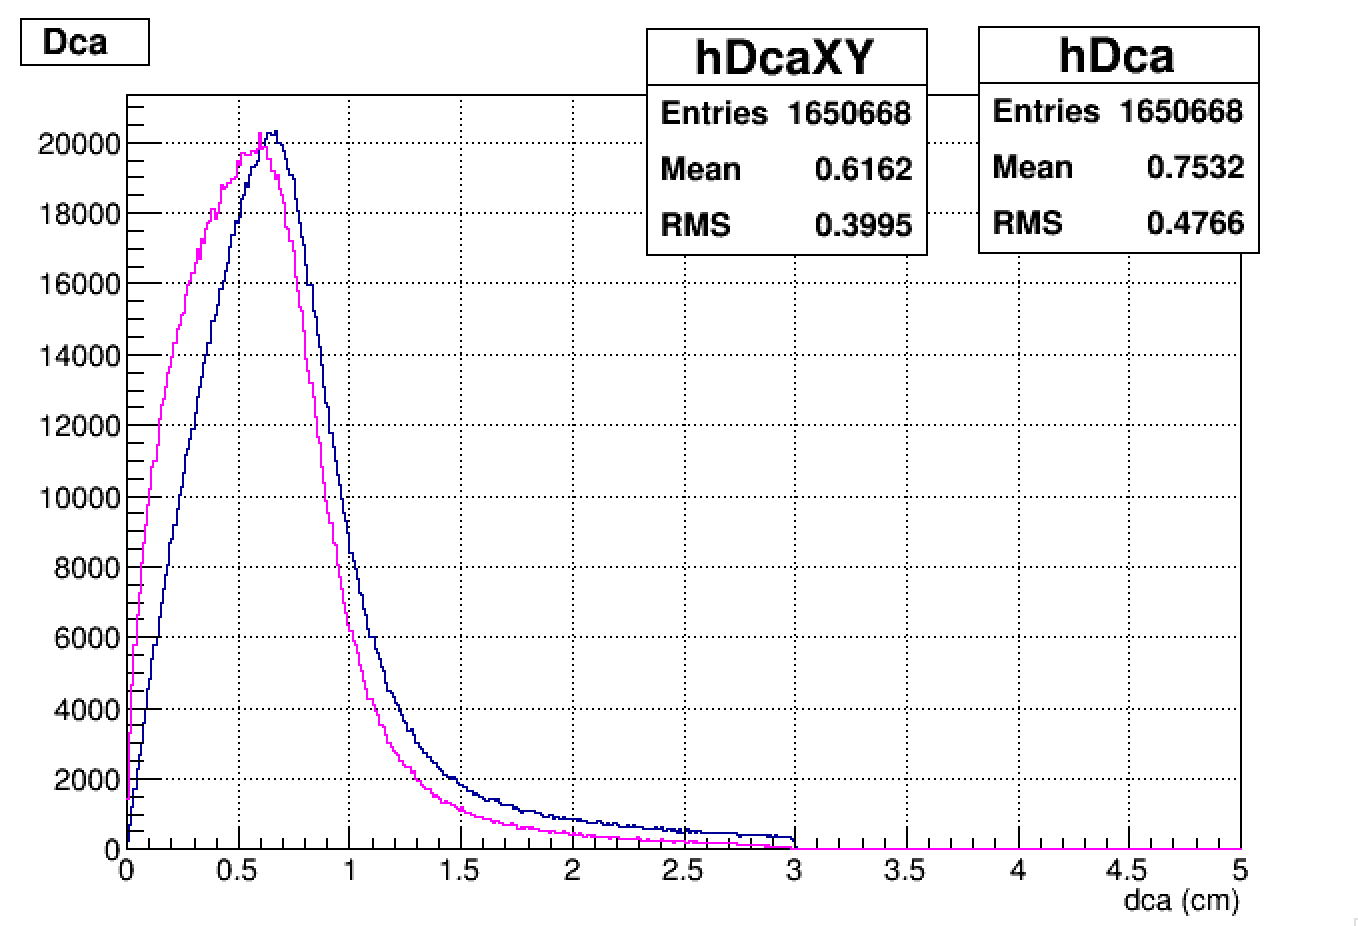
The plot shown above is the primary tracks DCA distribution from run9. A stranger distribution is shown.
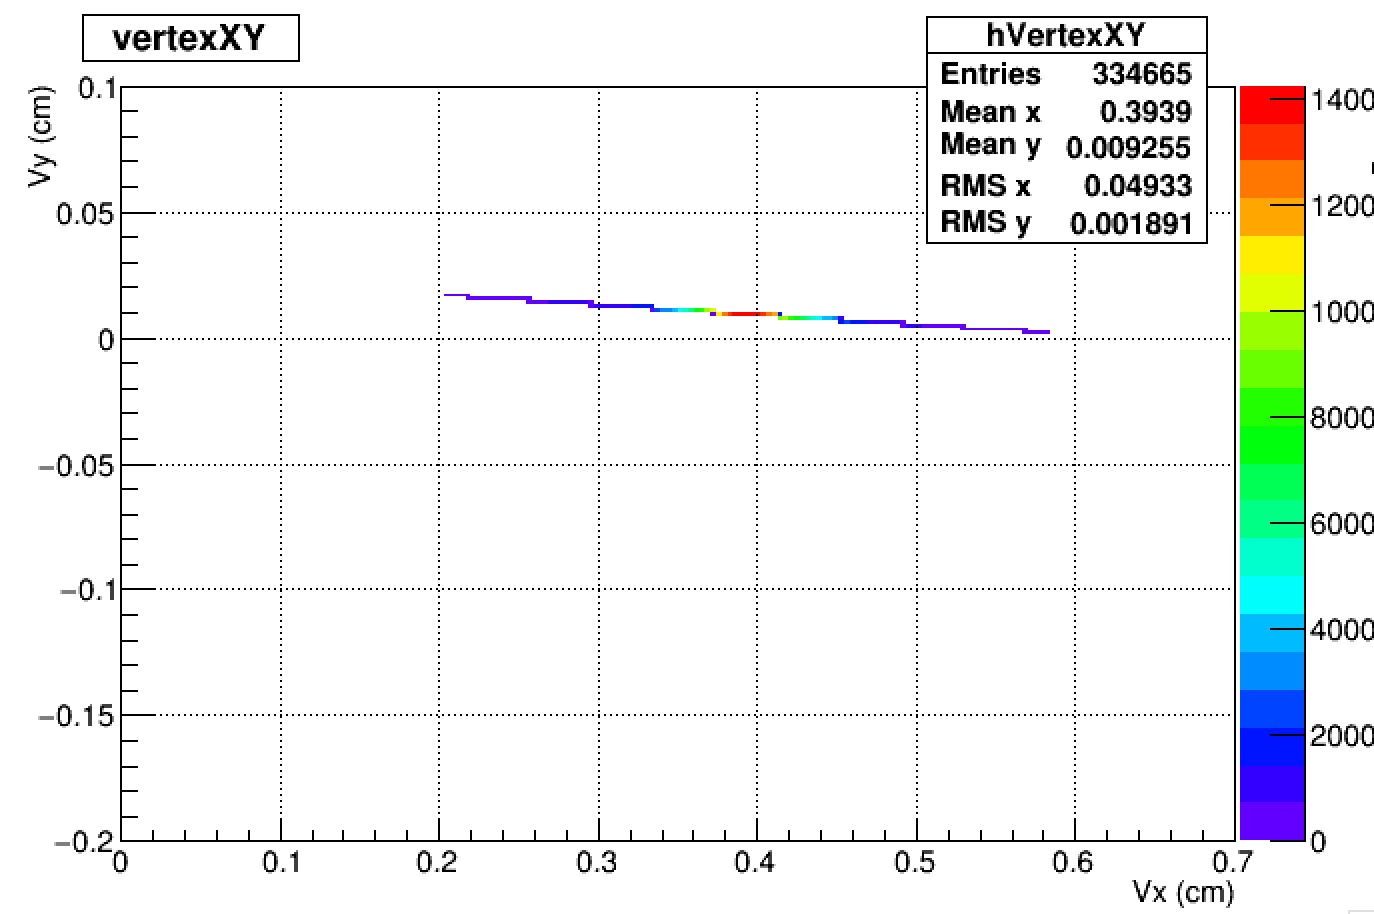
First checked the vertex distribution. The vertex position in X direction in peak at 0.4cm, while the position in Y direction is all located in the positive side but with a very small deviation.
.png)
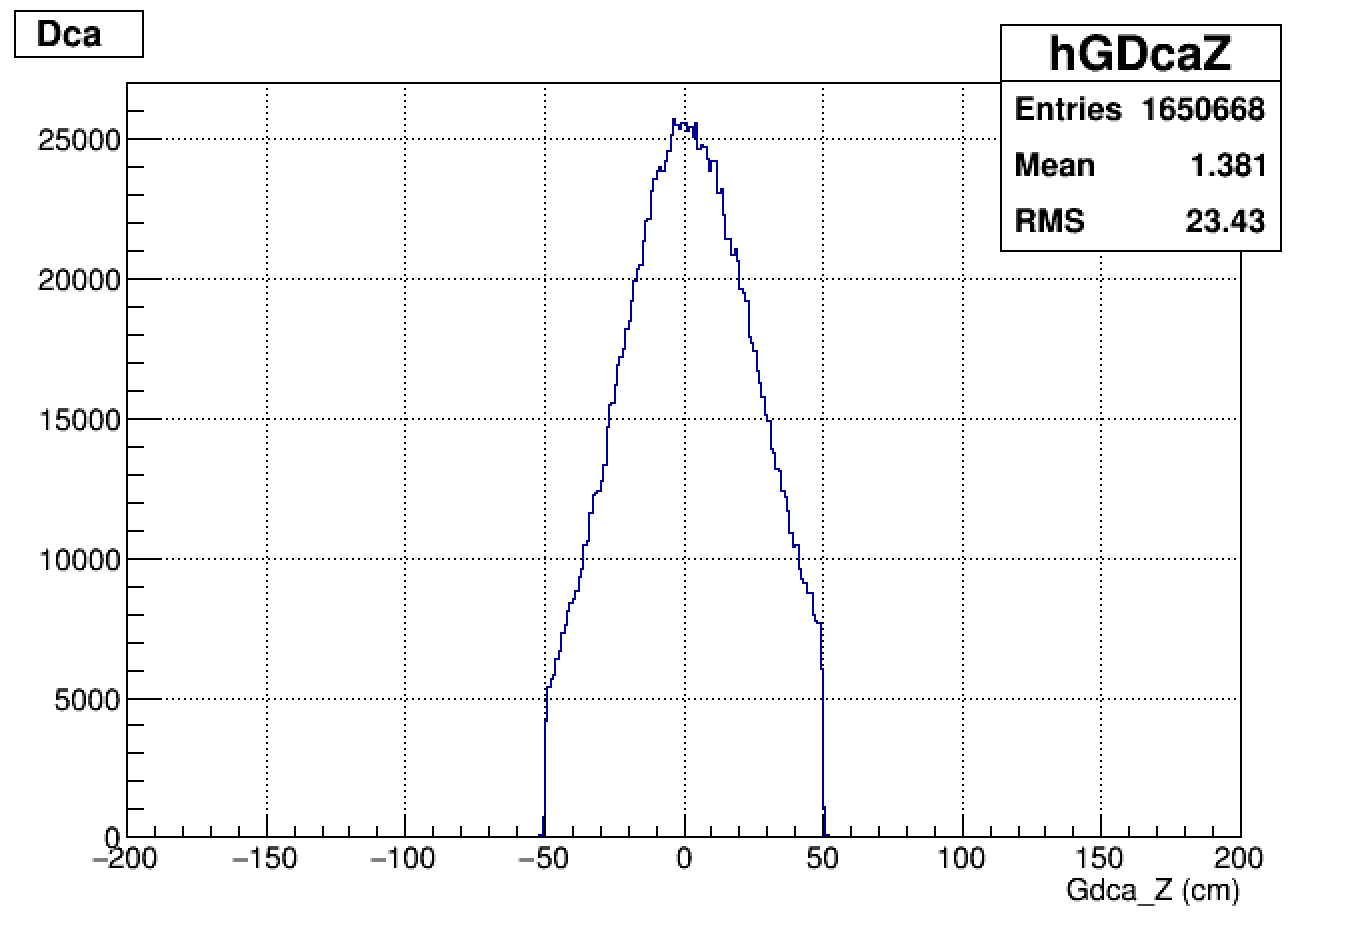
The Dca distribution in z and r
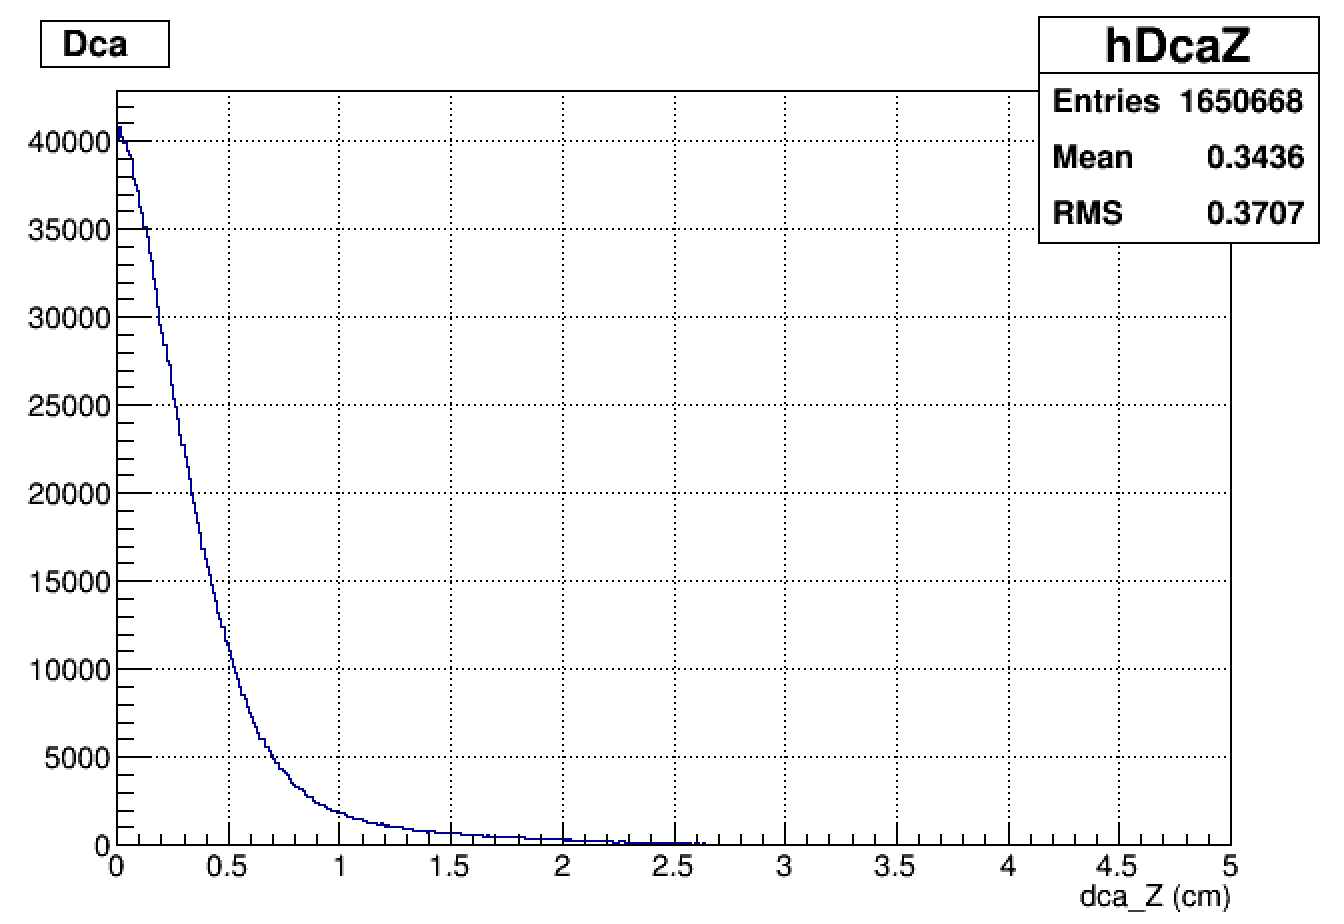
From above , the stranger Dca structure is mainly from the R direction. Aslo shown in below.
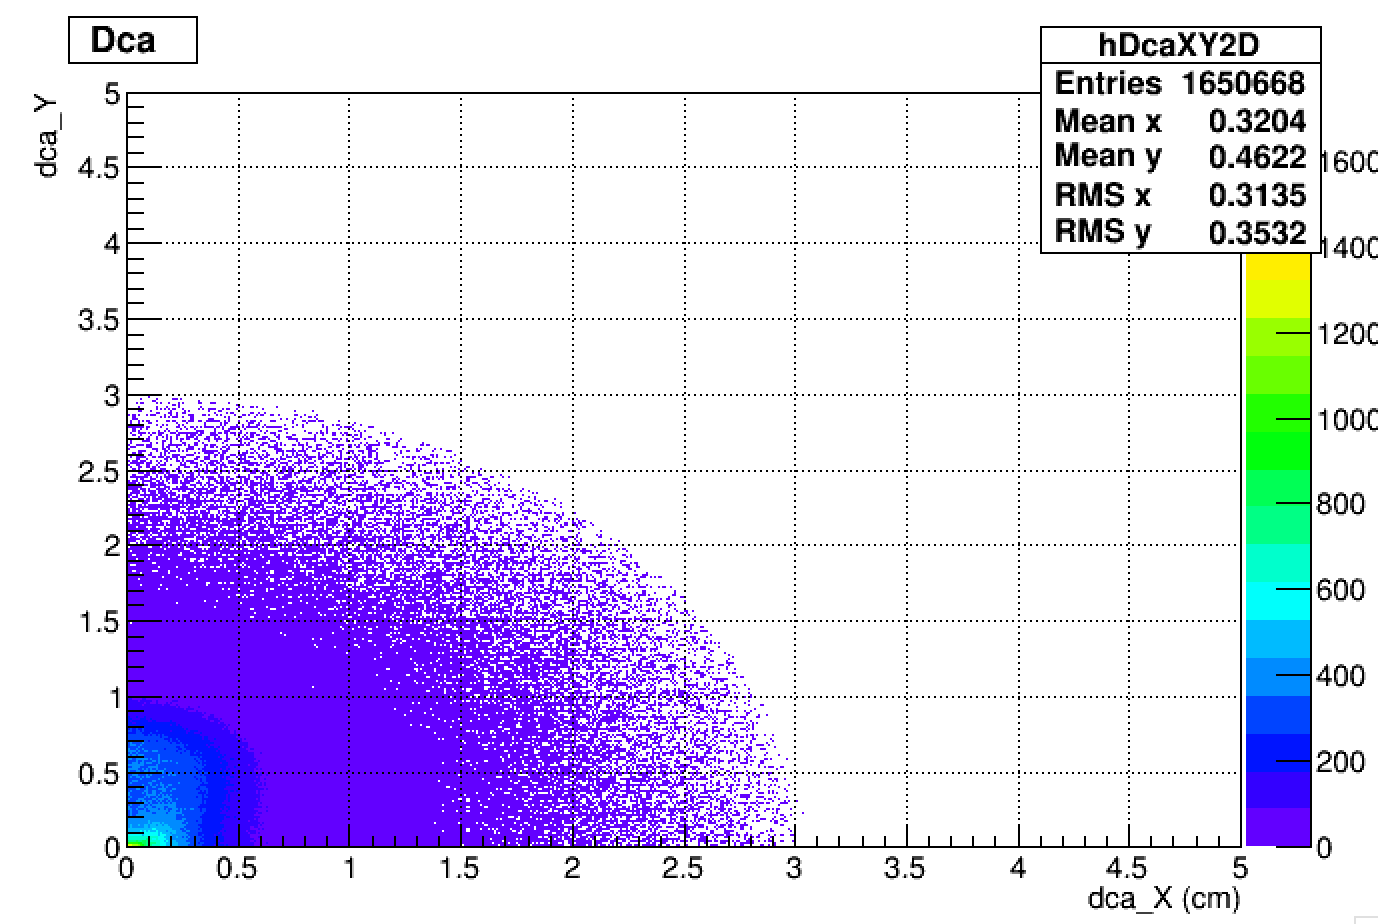
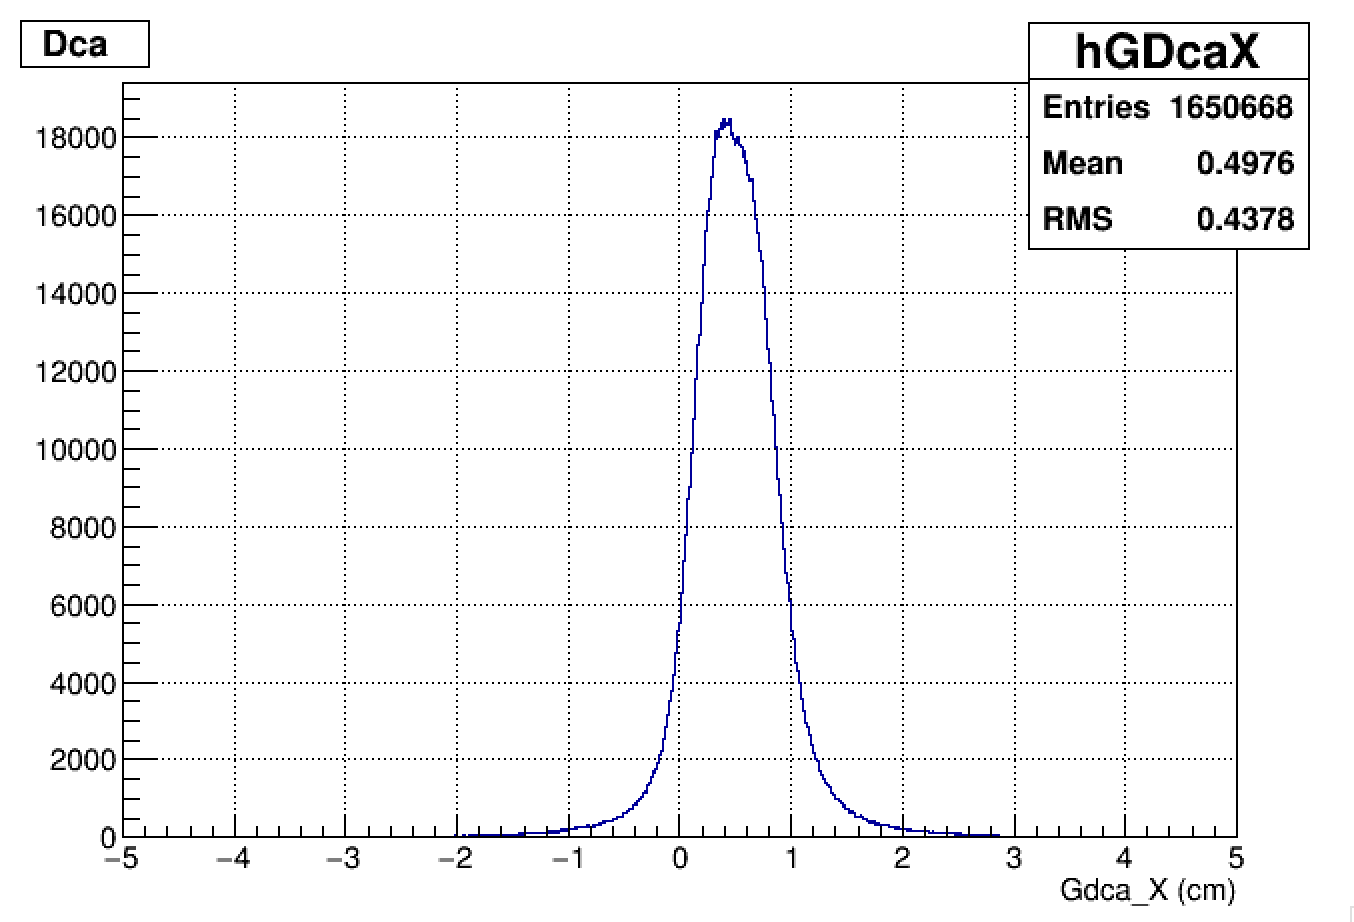
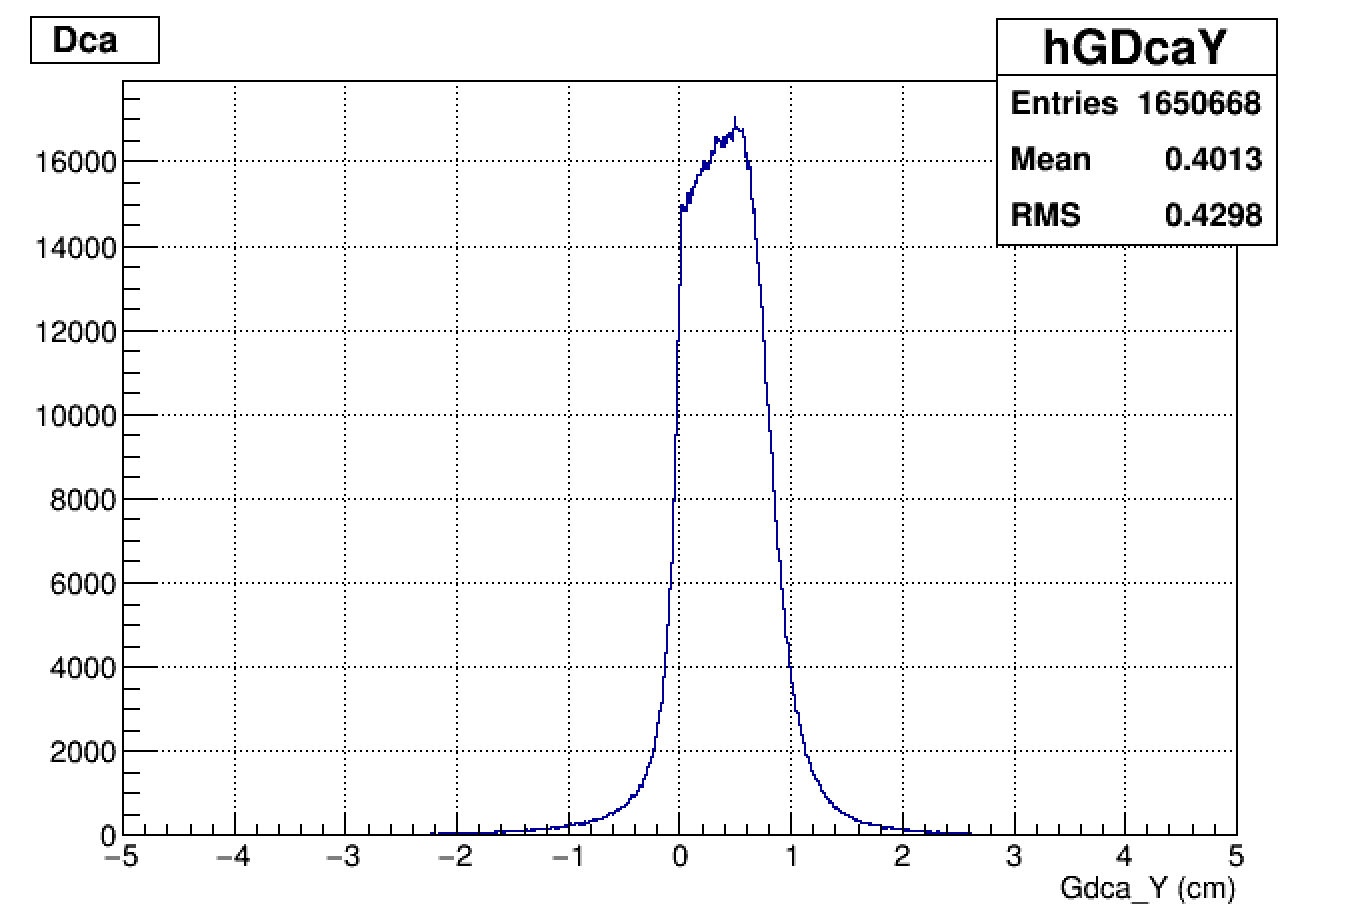
Then I checked the dca point distribution from helix for primary tracks. The track projection in the X and Y distribution is shown below, the distribution in X could be understood as the vertex in X peaked at 0.4 cm. However, the distribution in Y distribution is not understandable.
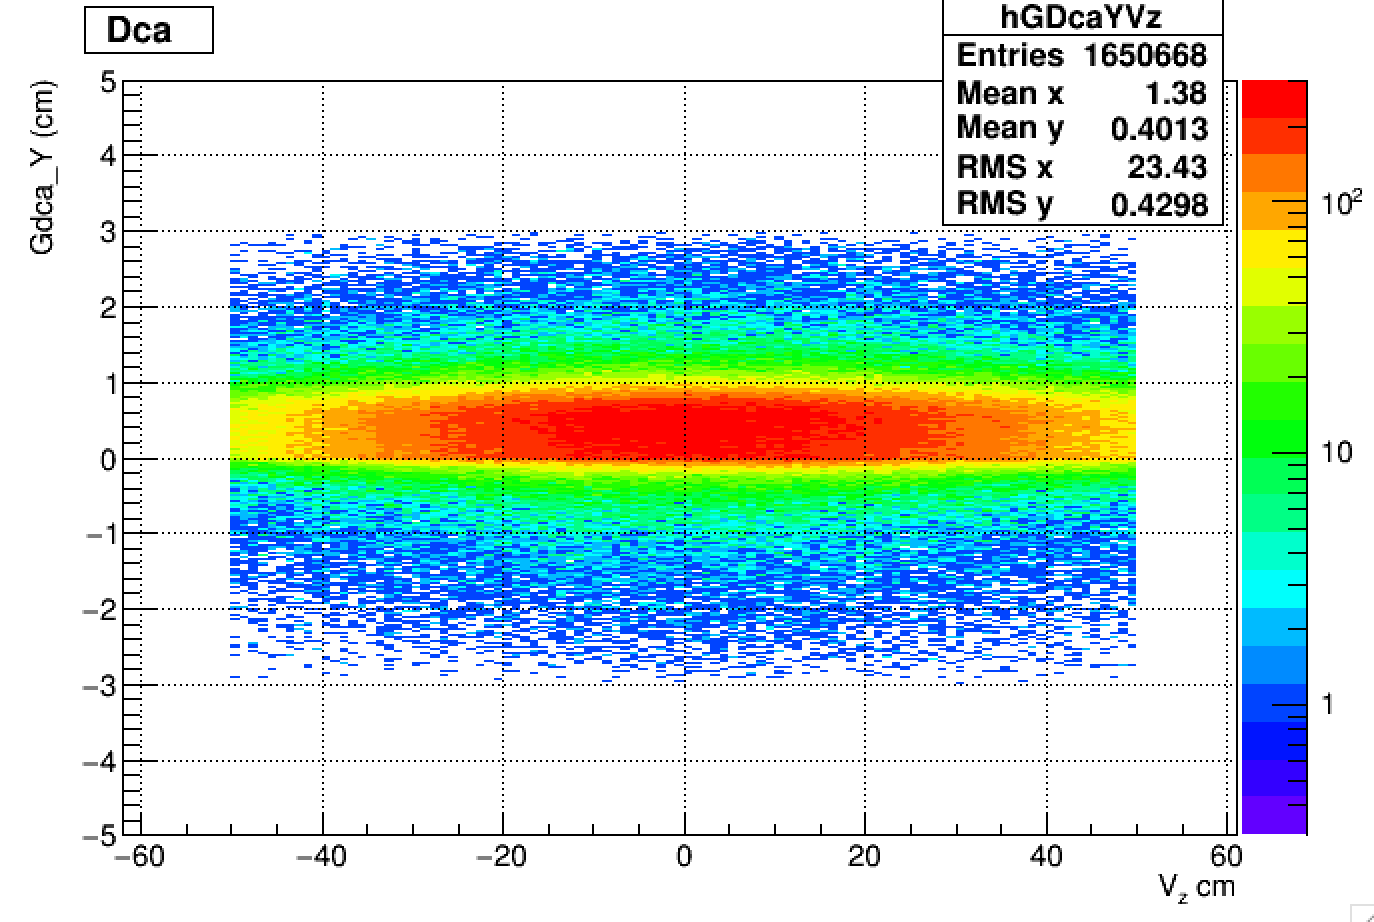
The stranger Gdca_Y distribution shows no Vertex z dependence. Could the due to the vertex reconstruction?(beam line).
- tc88qy's blog
- Login or register to post comments